


BTC is still trading inside the corrective range that formed after the strong drop from the $94.000,00–$96.000,00 area. The market is testing demand around the IC level after a run on the lows, while supply sits higher near the daily high and first structure. Intraday volatility increased today but has not yet broken the broader daily range.
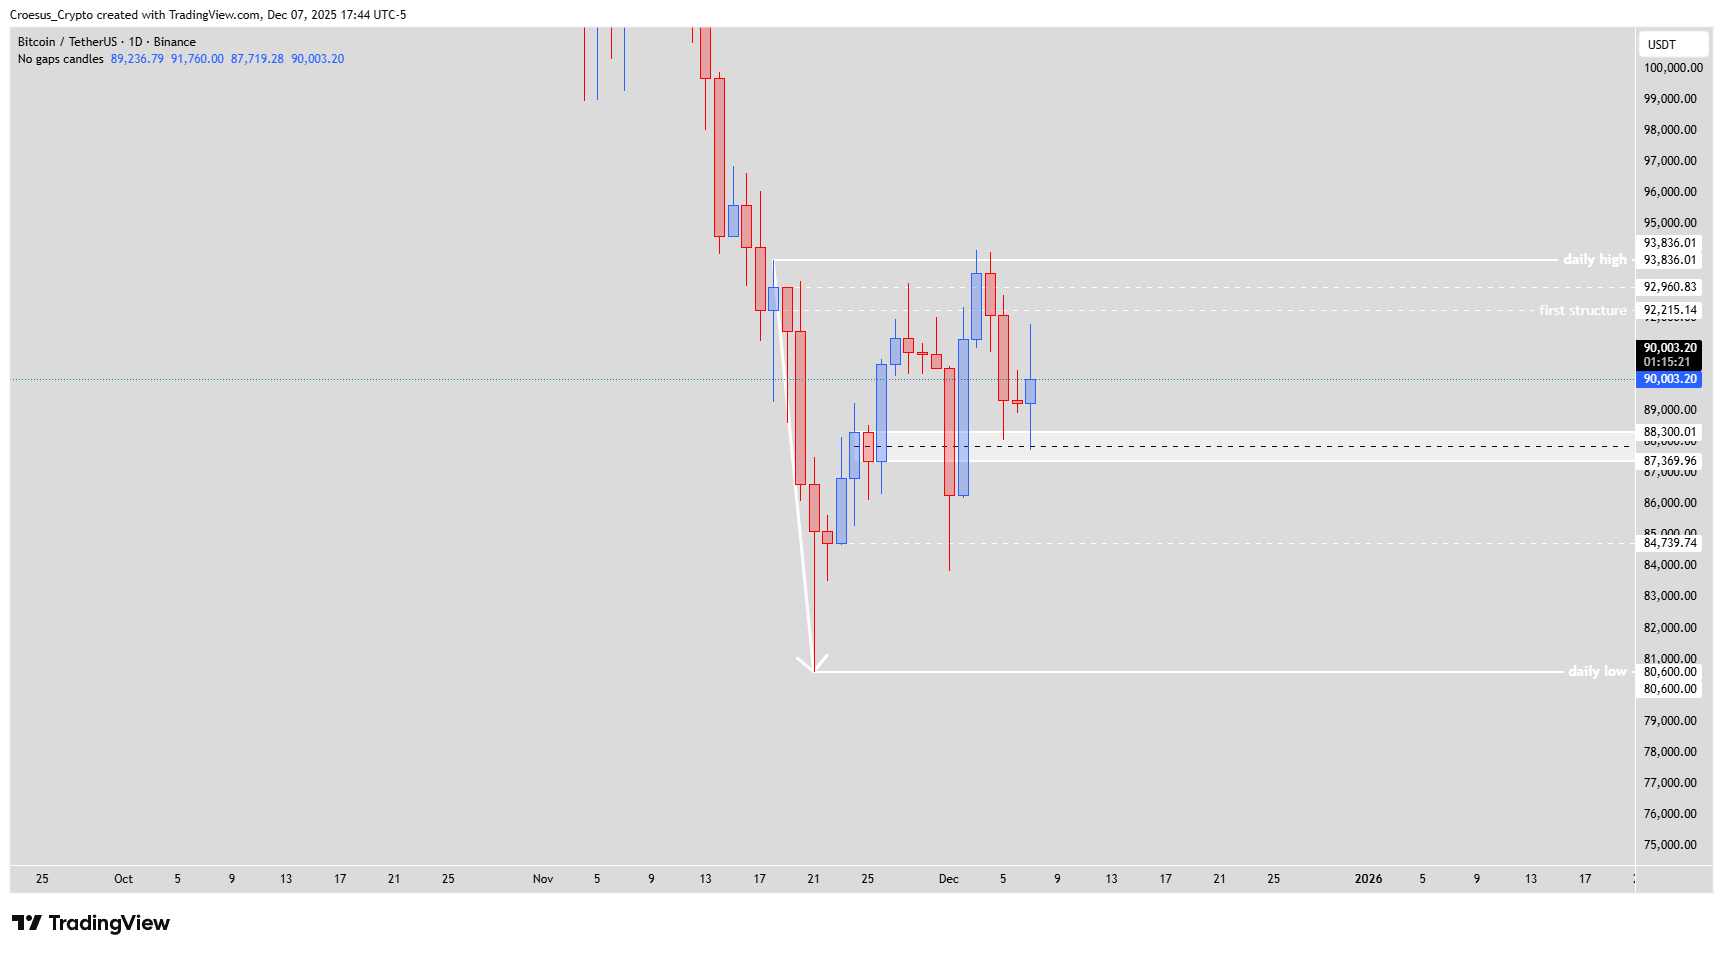
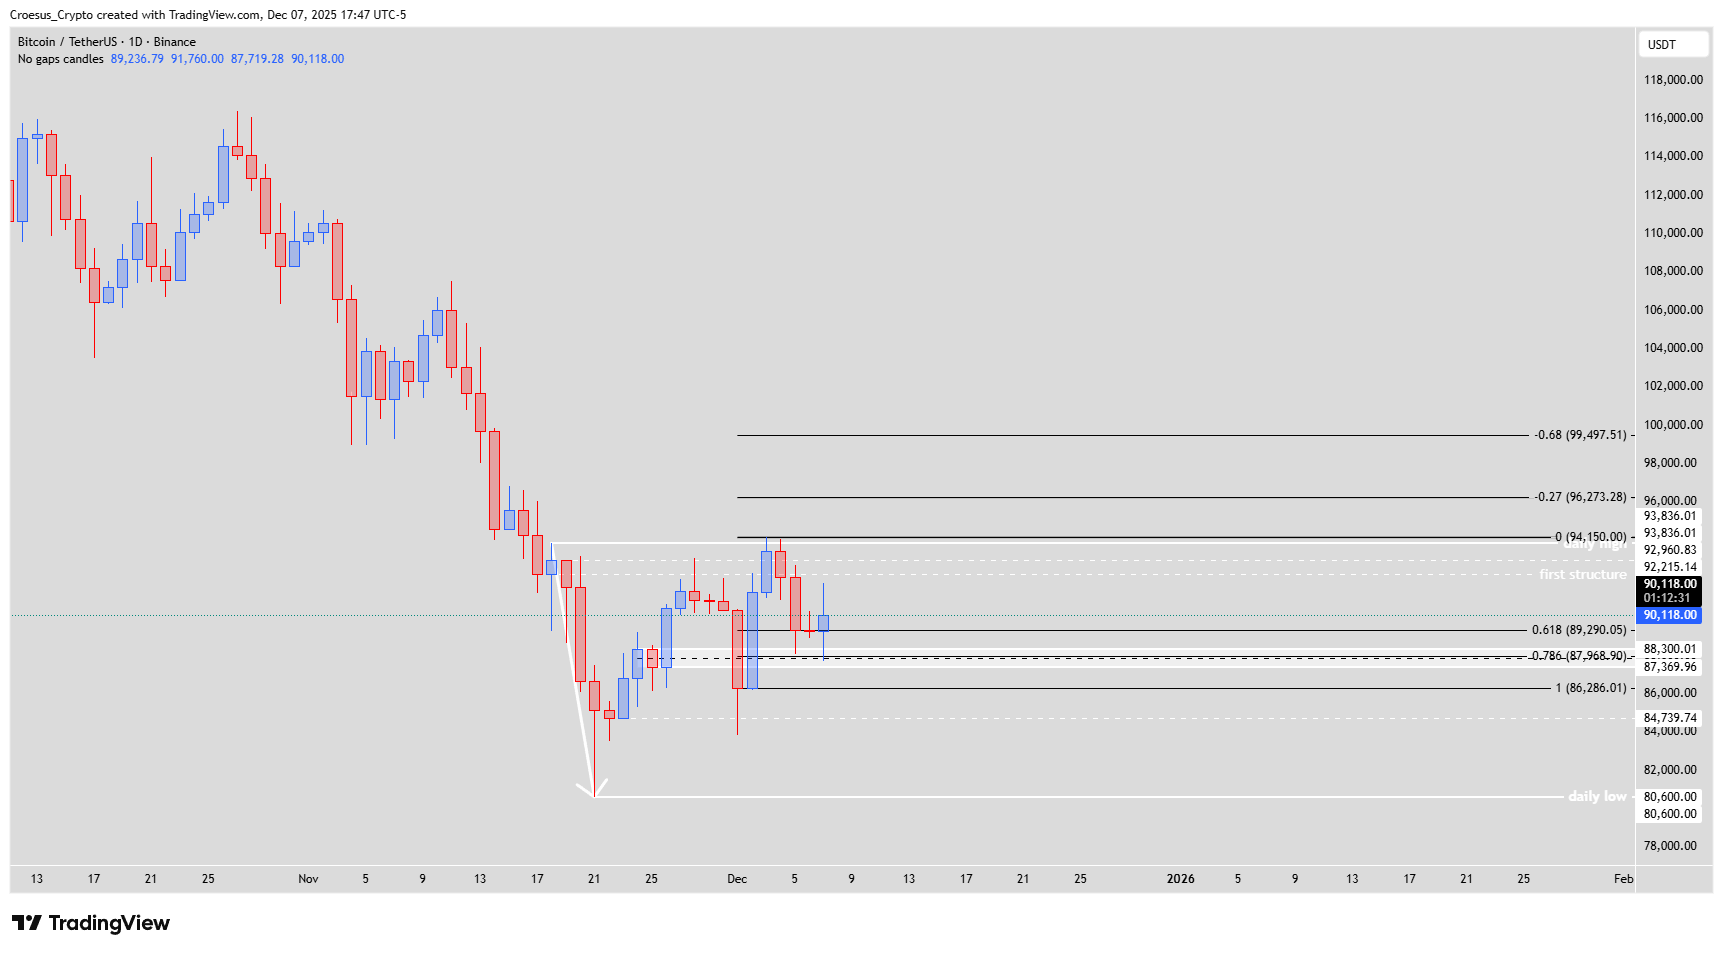
Daily chart BTCUSDT – price ranging between IC retracement band and daily high at $93.836,01
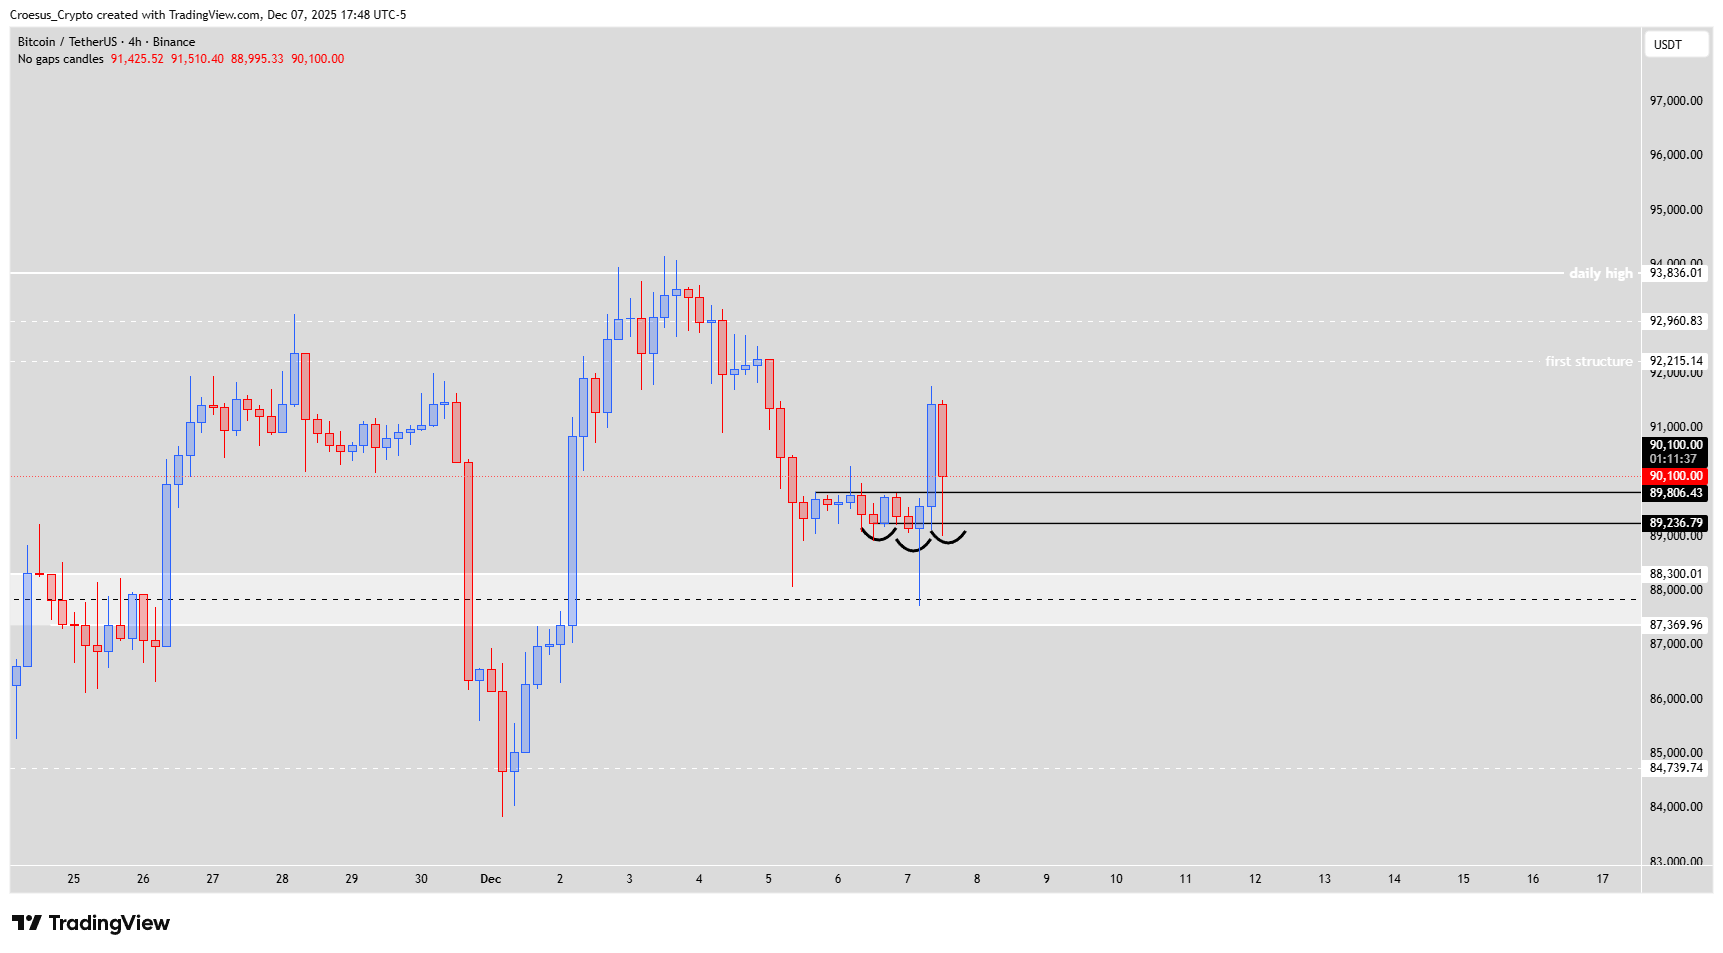
4H chart BTCUSDT – possible inverse head and shoulders forming around IC level $89.236,79 after a sweep of the lows
Trend = bearish ↓
Technical Analysis Key Points
- Yesterday we saw an indecision day (small body and relativ equal wicks).
- Today the price printed a run on the lows first followed by an impulsive bullish reaction, followed by an evenly impulsive bearish candle (clearly visible on the 4H chart)
- On the 4H we can a potential formation of a inverse head and shoulders pattern. This could initiate some bullish reaction.
- Bullish set-up : we have a switch of momentum. If price corrects towards the IC-level we could see the formation of a inverse head and shoulders pattern, where the IC-level would act then as the shoulder level. During an eventual retrace we will be watching the price action at this level.
- Bearish set-up : market structure is still predominantly bearish, the daily still isn't broken, not even touched. This means that price possibly prints a natural bearish W. This means that after a bearish W, price prints equal lows and equal highs, confirming the first bearish W.
Market Structure Analysis
Daily timeframe
The strong leg down from around $94.150,00 to the daily low near $80.600,00 still defines the main trend.
Current price trades inside the fib retracement band of that move, with the 0,618 level around $89.290,05 acting as local support and the first structure level near $92.215,14 as resistance.
Yesterday’s indecision candle shows balance around this retracement, with neither buyers nor sellers in full control.
The daily high at $93.836,01 remains untested. As long as this level is not broken, the broader trend stays bearish and any rallies are still corrective in nature.
4H timeframe
On 4H, today’s session first swept the recent swing lows below $89.000,00, then pushed up strongly toward $91.000,00, and finally retraced with an equally strong bearish candle.
The lows around $89.236,79 mark the IC level and the area where the potential inverse head and shoulders is shaping up. The recent sweep forms the head, while the earlier lows create the shoulders.
So far price is rotating between this IC demand zone and intraday resistance just above $90.000,00.
There is a clear short term switch of momentum from the absolute low, but this is not yet confirmed as a higher time frame reversal.
Key Levels and Scenarios
Key levels
Daily high resistance: $93.836,01
First structure resistance: $92.215,14
Local intraday resistance zone: $90.800,00–$91.500,00
IC and shoulder zone on 4H: $89.200,00–$89.300,00
Support band below IC: $88.300,01 and $87.369,96
Deeper support and fib cluster: $86.286,01
Major daily low: $80.600,00
Bullish scenario
Price holds above the IC level and the head and shoulder lows around $89.200,00–$89.300,00.
During a retrace, 4H candles show strong reactions in this zone, confirming it as the shoulder level of the inverse head and shoulders.
From there BTC builds higher lows on 4H and breaks back above $90.800,00–$91.500,00.
A clean break and hold above first structure $92.215,14 opens the way for a test of the daily high at $93.836,01 and possibly the higher fib extensions around $96.273,28 and $99.497,51.
Bearish scenario
Price fails to defend the IC zone and 4H candles close below $89.200,00 with no quick recovery.
Alternatively, BTC can first bounce higher but then reject again from first structure $92.215,14 or from the daily high $93.836,01 without a daily close above.
In both paths, the broader bearish trend remains intact and the market may complete a natural bearish W on the higher timeframe: after the first W, price prints equal lows and equal highs, confirming the strength of the first pattern.
Downside targets in that case are the supports at $88.300,01 and $87.369,96, then the fib 1 level around $86.286,01, and in an extended move a revisit of the daily low near $80.600,00.
Trading Implications
For bullish traders
The cleaner long setups are found if price corrects into the IC shoulder zone at $89.200,00–$89.300,00, shows clear 4H rejection and then breaks back above $90.800,00–$91.500,00.
Until the daily high and first structure are broken, treat all longs as trades inside a broader bearish context. Position size and risk per trade should stay modest.
For bearish traders
Failed attempts to break above $92.215,14 or the daily high at $93.836,01 keep the bearish W scenario in play and offer tactical short opportunities, as long as invalidation is kept just above the rejected level.
A decisive 4H or daily close below $89.200,00 would be a strong signal that bulls lost the IC zone and that lower supports are likely to be tested.
For neutral or patient traders
With daily structure still bearish and 4H trying to form a reversal pattern, the market is in a conflict zone. Waiting for either a confirmed break above $92.215,14 or a confirmed loss of $89.200,00 avoids getting chopped in both directions.
This content is for educational purposes only and is not financial advice; always do your own research before making any investment or trading decisions.