

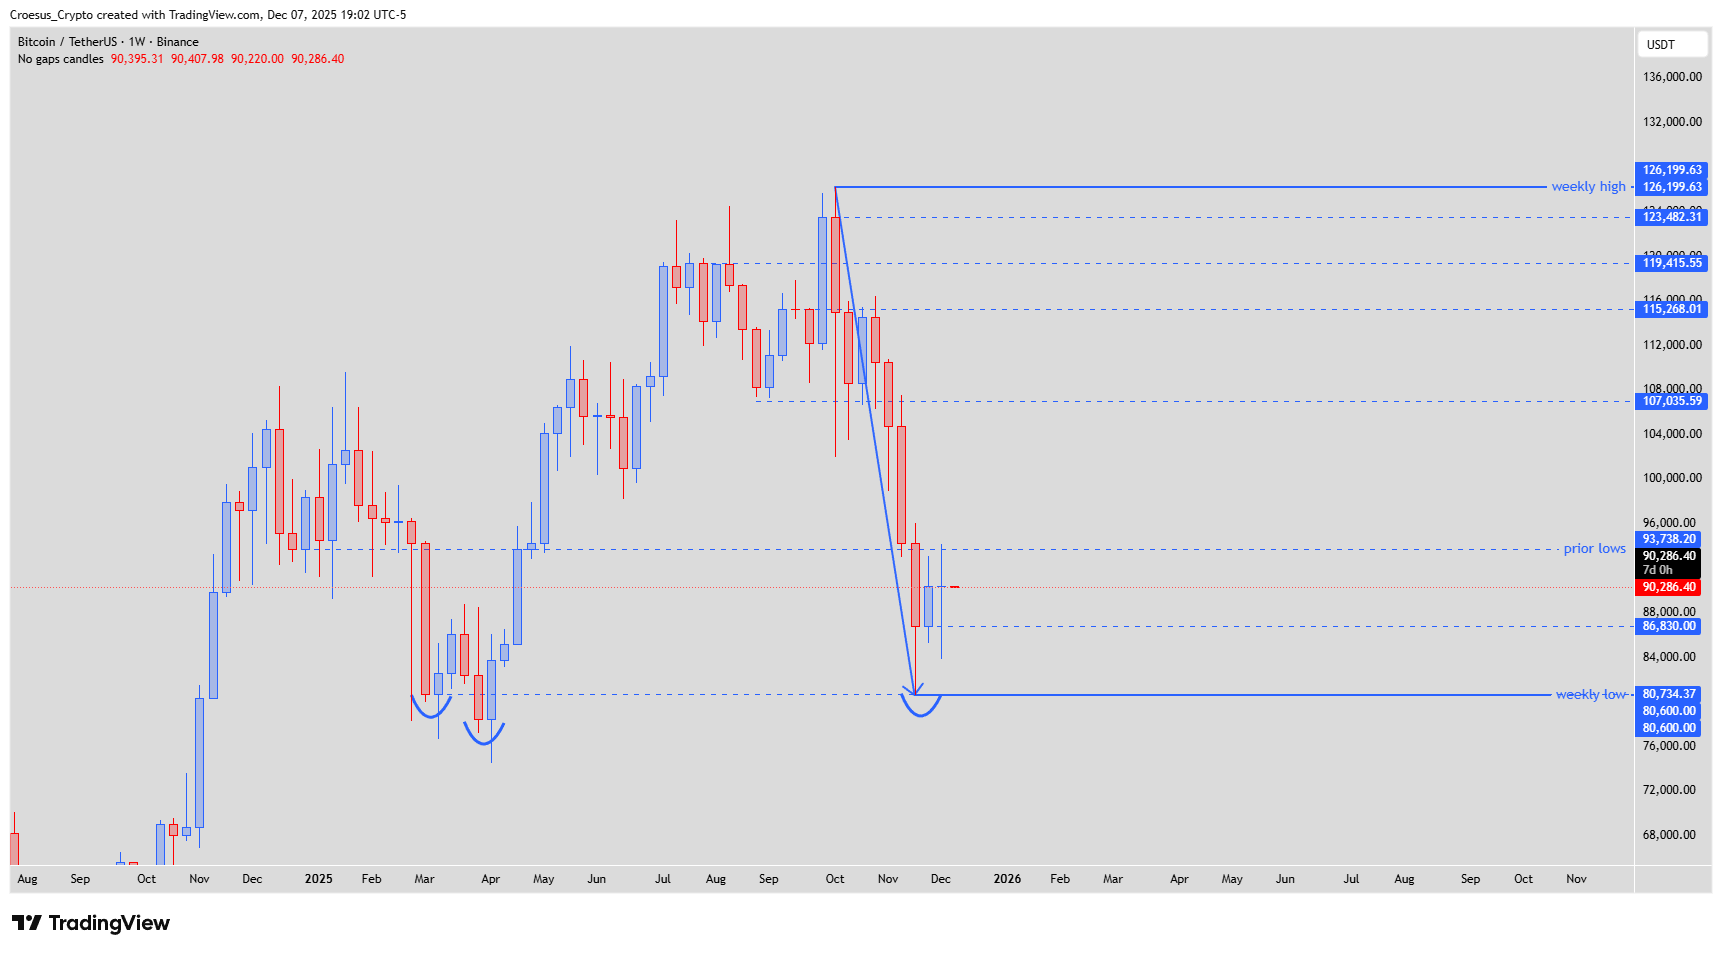
BTC has printed a very strong weekly down leg, followed by the first meaningful bullish reaction from the weekly low area near $80.734,37. Over the last two weeks the market has been oscillating between that low and the prior lows around $93.738,20. This week’s candle shows wicks on both sides and a small body, signalling indecision and a pause inside a possible corrective phase rather than a confirmed new trend.
Weekly chart BTCUSDT – strong bearish leg into $80.734,37 weekly low, followed by an indecision candle between weekly low and prior lows at $93.738,20
Technical Analysis Key Points
- Price retested the highs and lows but did not succeed in breaking on or the other, printing an indecisive candle.
- As we saw a first bullish candle after a strong bearish impulsive sequence, we could suppose this was the start of a bullish correction.
Market Structure Analysis
The dominant structure on the weekly chart remains a clear bearish impulse from the region above $120.000,00 down to the weekly low at roughly $80.734,37.
The strong reaction from that low last week printed the first bullish weekly candle after the sell-off, signalling that aggressive selling pressure has paused and that buyers are willing to step in at this level.
This week’s candle retested the prior lows zone around $93.738,20 from below and wicked back down toward the $86.830,00–$88.000,00 region, but closed in the middle of the range with no break in either direction.
The prior lows at $93.738,20 now act as resistance. As long as that band is not broken and turned into support, the current move is best seen as a corrective bounce within a broader bearish leg, not as a confirmed mid- or long-term trend reversal.
Below, the weekly low at $80.734,37 is still the key structural support, with the recent wick showing liquidity was taken there but so far defended.
Key Levels and Scenarios
Key levels
Weekly high region: around $126.199,63
Intermediate resistance levels: $119.415,55 and $115.268,01
Prior lows / key resistance: $93.738,20
Mid-range support: about $86.830,00
Weekly low and current main support: $80.734,37 (around the $80.600,00 wick area)
Bullish scenario
Buyers continue to defend the mid-range and, more importantly, the weekly low around $80.734,37.
BTC breaks above the prior lows zone at $93.738,20 with a strong weekly close and then retests this level as support.
If that retest holds, the corrective bullish phase can extend higher toward $107.035,59 and then into the resistance layers around $115.268,01–$119.415,55.
Only if price later reclaims and holds above these levels does the structure start to shift from “bearish impulse + correction” to a more neutral or even bullish weekly trend.
Bearish scenario
The prior lows around $93.738,20 continue to act as firm resistance and weekly candles fail to close above this band.
Selling pressure then pushes BTC back through the mid-range support near $86.830,00 and retests the weekly low area at $80.734,37.
A decisive weekly close below $80.734,37, followed by a failed attempt to reclaim it, would confirm bearish continuation and open room for a new leg down toward lower untested liquidity zones below the current chart.
In that case, the recent bullish candle would be confirmed as only a brief relief rally within the broader downtrend.
Trading Implications
For position or swing traders looking for longs
Any long exposure here is still against the dominant weekly impulse. Longs are more defensible if BTC can close a week above $93.738,20 and then retest that zone successfully as support.
Until that happens, treat long setups from mid-range or from near $80.734,37 as tactical trades with conservative position sizing and clear invalidation below the weekly low.
For traders looking for shorts in trend direction
Repeated rejections from $93.738,20 offer trend-following short opportunities, with invalidation just above that zone.
A fresh move down that closes below $86.830,00 and especially below $80.734,37 would strengthen the bearish continuation case and may justify adding or initiating swing shorts targeting lower levels.
For patient traders
The current indecision candle between prior lows and the weekly low shows that the market is still searching for direction after the first bounce.
Waiting for either a confirmed weekly reclaim of $93.738,20 (for a larger correction) or a clean breakdown below $80.734,37 (for trend continuation) can reduce whipsaw risk and provide clearer, higher-conviction entries.
This analysis is not financial advice; always do your own research and manage your risk before trading.