


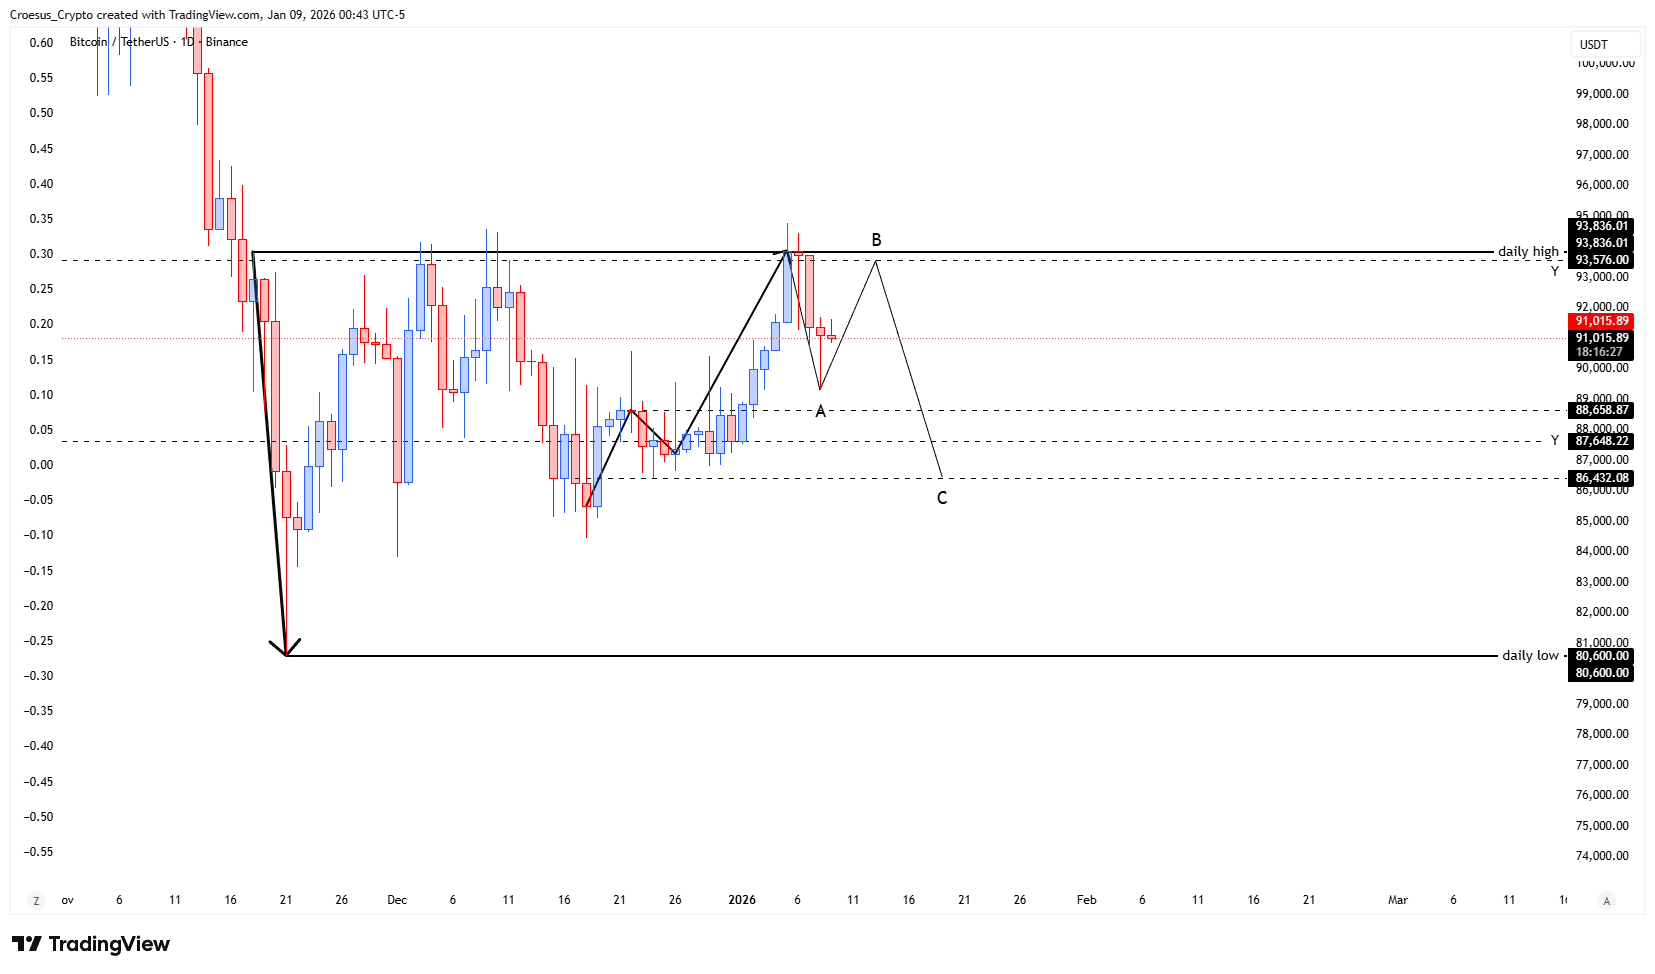
In this Bitcoin daily analysis for 08 January 2026, we see price starting to correct the strong bullish impulse that began in the first week of the year. After a sharp leg up into the prior daily high, price has stalled and pulled back, suggesting that short-term buyers are taking profits at resistance. This is a classic pause within a broader uptrend and sets the stage for a potential ABC correction, according to our technical analysis and support resistance mapping.
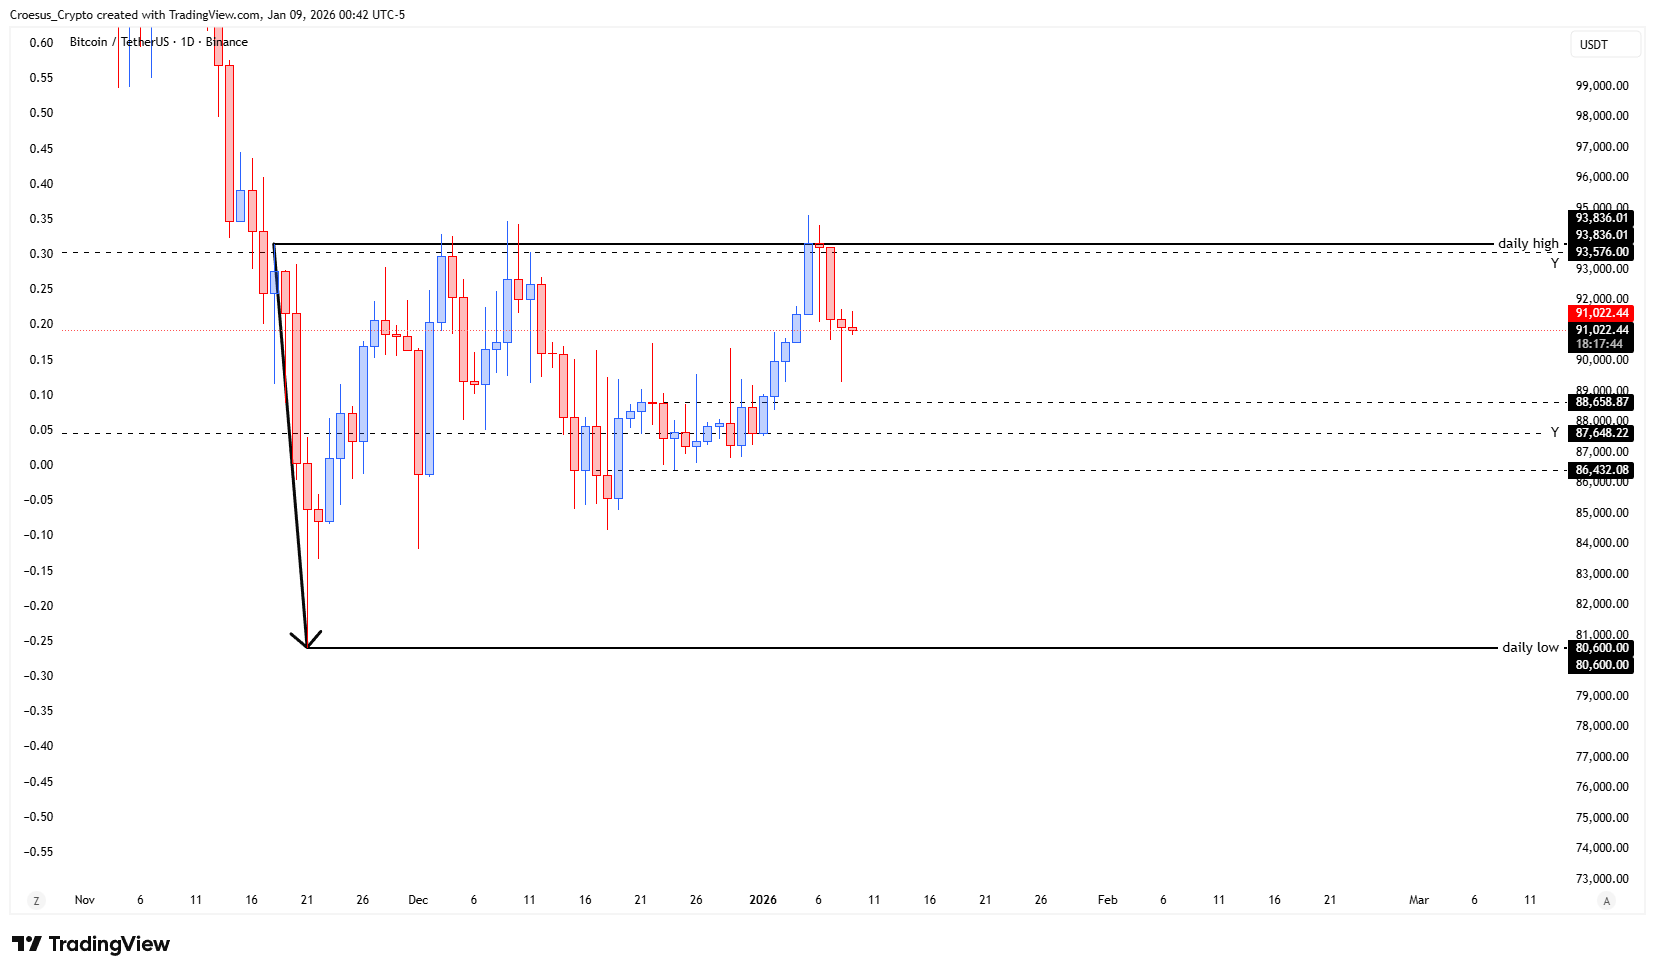
Bitcoin daily chart 8 January 2026 with projected ABC correction and $88.6K–$86.4K target zone around yearly low.
Technical Analysis Key Points
- As indicated yesterday the price has started the correction of the bullish impulse that started in the first week of this year.
- We could see a retest of the highs, which would fit in the set-up of an ABC-correction. Yesterday's wick indicates that we could see some bullish shortterm relief.
- But at this moment the zone between $88.658,87 (first structure) and $86.432,08 (shoulder 2 level) remains our target. Notice right in the middle is the $87.648 yearly low.
Market Structure Analysis
Our Bitcoin daily analysis frames the current pullback as the A-leg of an ABC correction within a larger bullish structure. A potential B-leg could retest or marginally sweep the recent daily highs around the $93K–$94K area; yesterday’s upper wick shows that buyers are still active and could drive a short-term bounce.
The main structural focus remains the C-leg, targeting the zone between $88,658.87 (first structure support) and $86,432.08 (shoulder 2 level). The $87,648 yearly low lies right in the middle of this band, creating a strong confluence zone where we expect significant reaction if reached. Even without explicit Fibonacci levels in this setup, this cluster of prior structure and yearly reference levels is key for our technical analysis.
Key Levels and Scenarios
Bullish scenario: If price cleanly reclaims and holds above the prior daily high near $93K–$94K, the ABC structure could fail, opening room toward higher range extensions.
Key levels to watch:
$93K–$94K: Daily high resistance and potential B-leg topping area.
$91K: Short-term intraday pivot; above it, bulls retain control.
$88.658,87: First structure support; start of our main downside target zone.
$87.648: Yearly low sitting mid-zone; major decision level.
$86.432,08: Shoulder 2 support; lower bound of projected C-leg.
Trading Implications
For active traders, short setups near the daily-high resistance with clear invalidation, or patiently waiting for bullish reversal signals inside the $88.6K–$86.4K zone, offer the cleaner risk/reward profiles, while strict position sizing and stop placement below/above structure remain essential.
This is not financial advice; always do your own research and manage your risk appropriately.