


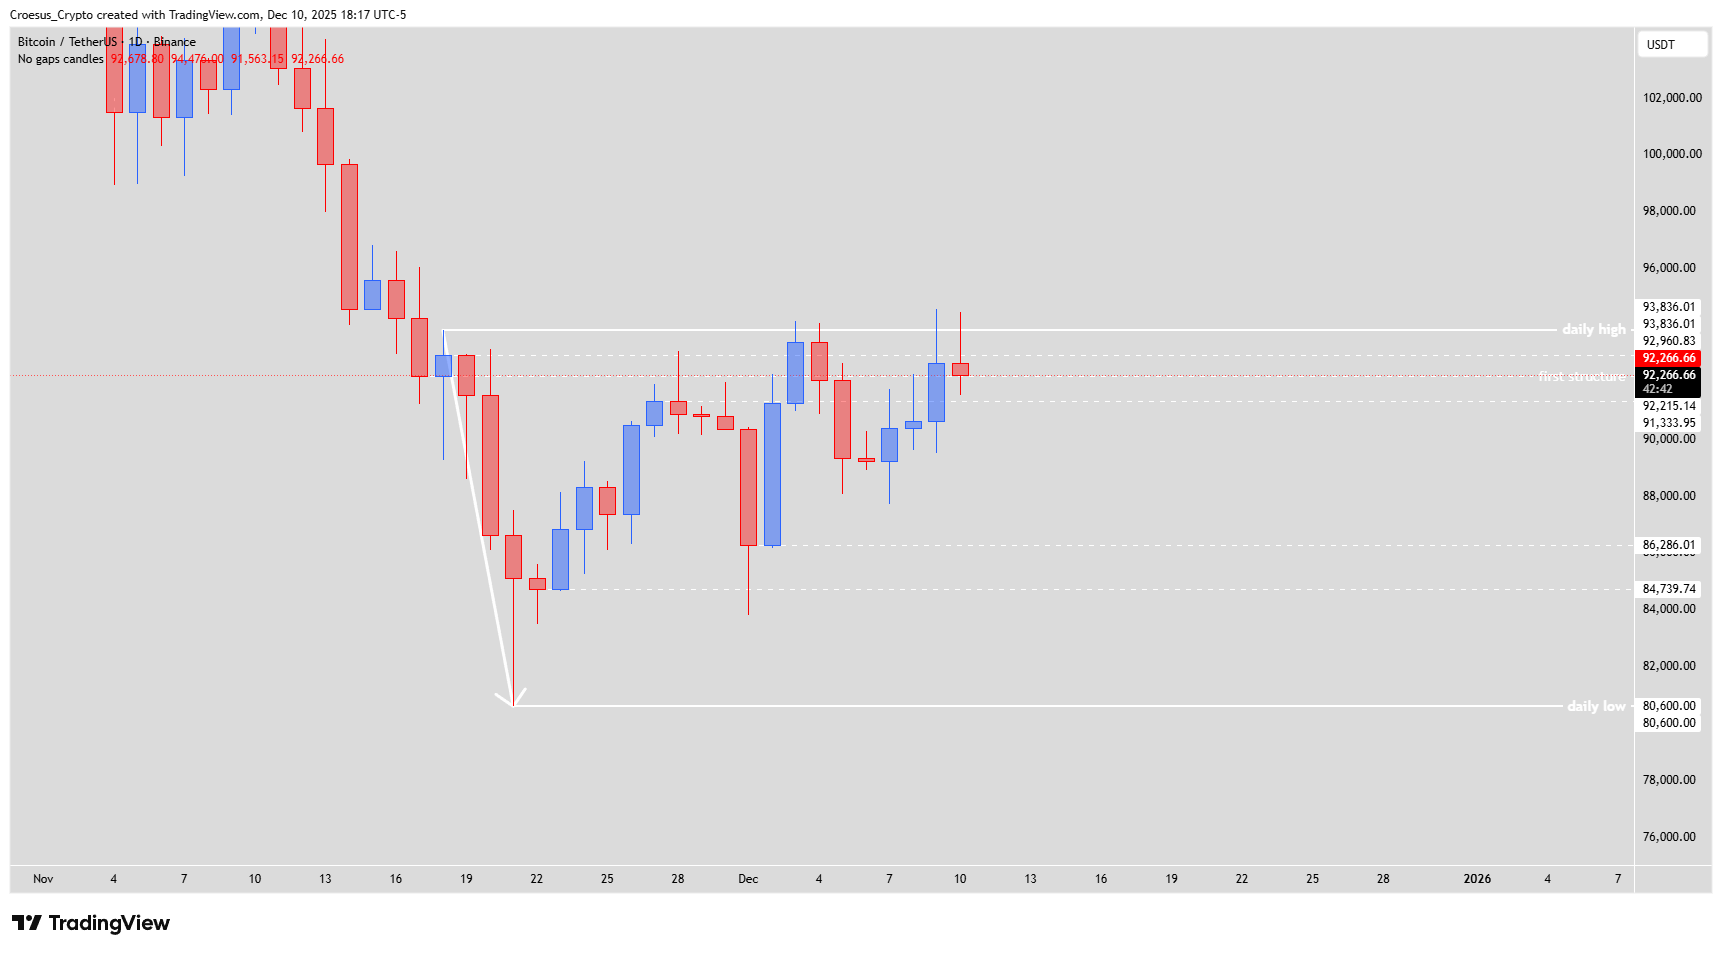
In this Bitcoin daily analysis for 10 December 2025 we review how price is reacting to the $93.8k daily high after a strong bearish leg and a slower corrective bounce inside a rising channel. Our technical analysis focuses on support resistance behaviour and competing head-and-shoulders setups.
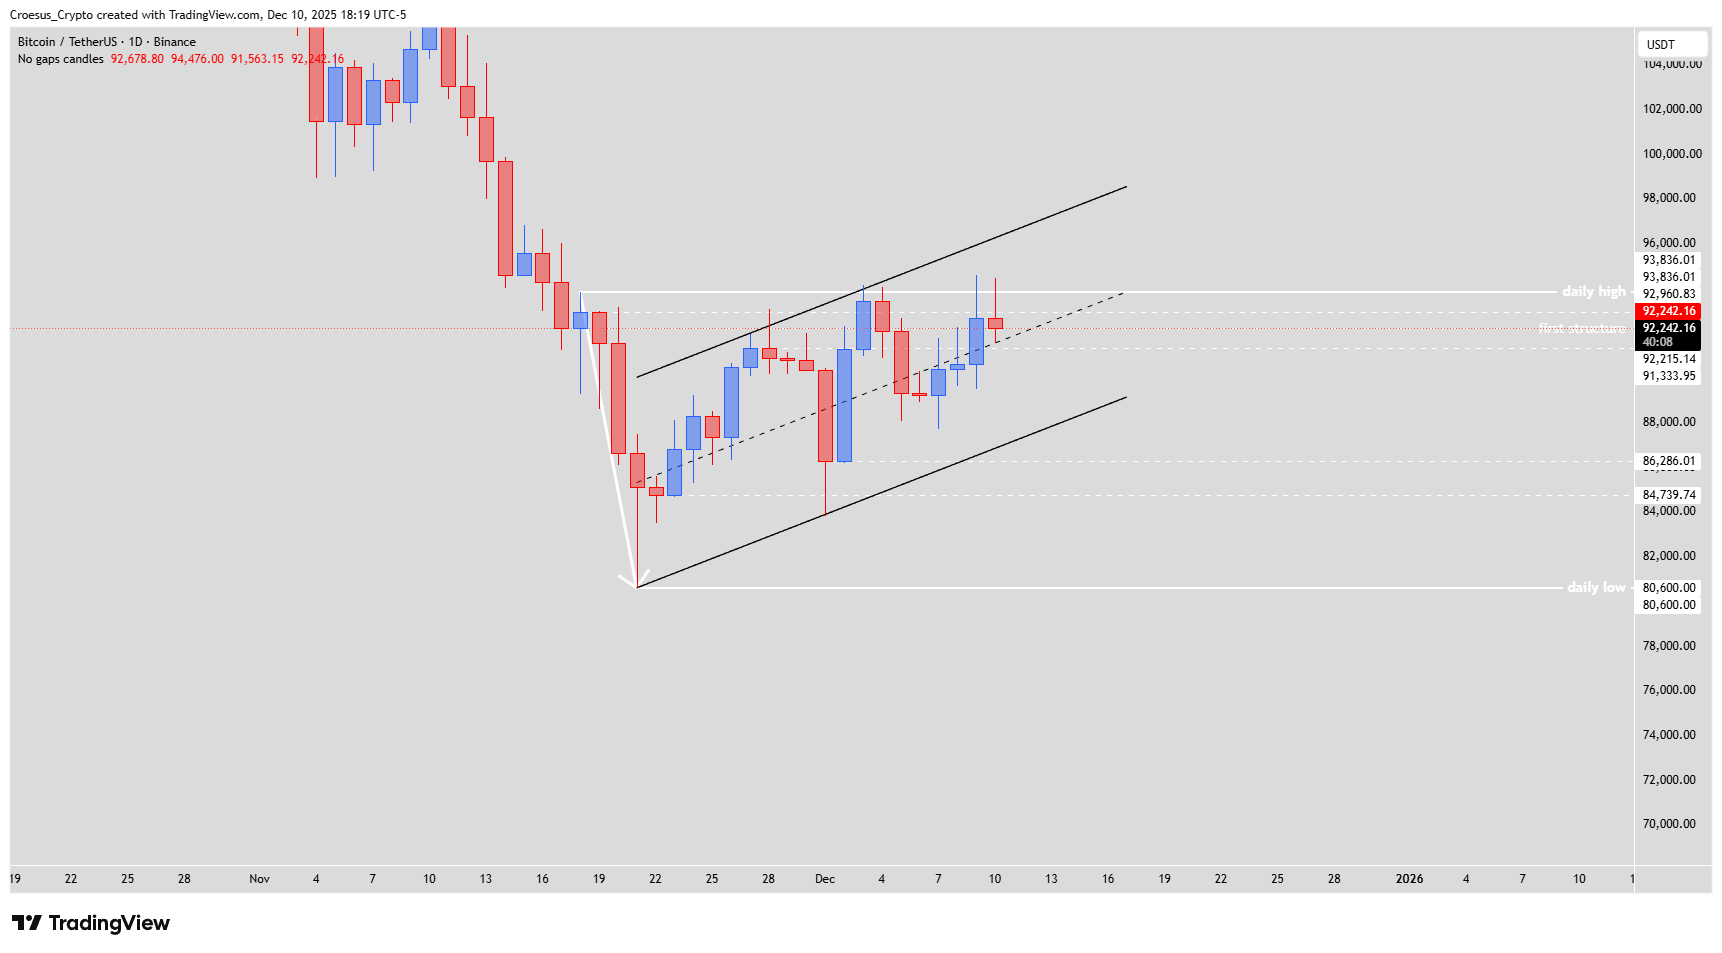
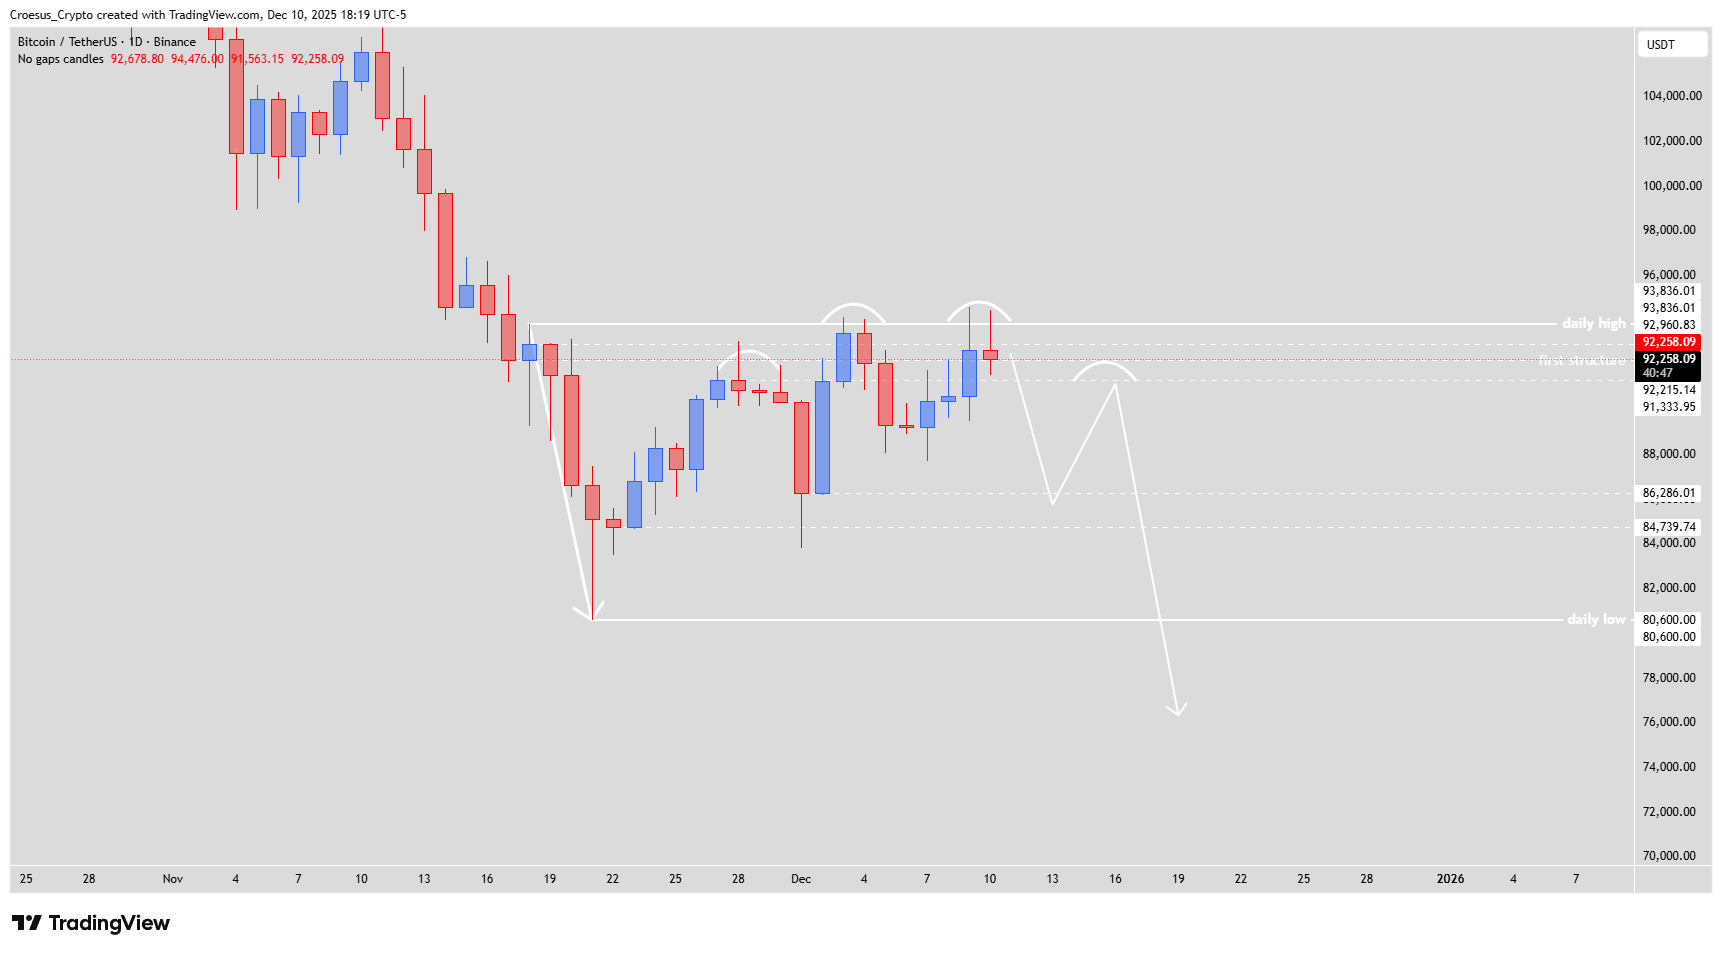
Bitcoin daily chart 10 December 2025 with rising channel, daily high resistance near $93,836 and potential head-and-shoulders structures
Technical Analysis Key Points
- Today the price retested the daily high again but couldn't close above. We can also see some bearish indications : the corrective phase is very slow, indicating that it takes way too long for bulls to outpower the bears. Bulls are getting exhausted. This slow correction forms a rising channel, a typical bearish indication.
- Traders with a bullish bias could see a potential inverse head and shoulders pattern with the head @ $86.286,01 and the shoulders @ $88.300,01. At this moment we would need a clear break above the daily high.
- Traders with a bearish bias, confluent with the predominant trend, could see a potential head and shoulders pattern with the head (double top) @ $93.836,01 (=daily high) and the shoulders @ $91.333,95.
Market Structure Analysis
Structurally, Bitcoin sold off impulsively into the daily low region around $80.6k before reversing into a much slower 18-day corrective advance. That advance is contained in a rising channel, which typically acts as a bearish continuation pattern when it follows a sharp drop.
The upper boundary of the move coincides with the daily high at $93,836.01, where repeated tests fail to close above, confirming significant overhead resistance.
Below, the first structure zone around the low $92k area and the shoulder zones at $91,333.95, $88,300.01 and $86,286.01 define layered support.
As long as price oscillates between these levels without a decisive breakout, Bitcoin remains in a corrective phase within a broader bearish trend, and both the bullish inverse head-and-shoulders and the bearish head-and-shoulders remain only potential patterns waiting for confirmation.
Key Levels and Scenarios
Bullish scenario:
Bulls need a clean daily close above the $93,836.01 daily high to confirm the inverse head-and-shoulders idea from $86,286.01–$88,300.01 and signal that the corrective phase is turning into a new impulse, where Fibonacci could then be used to project upside targets.
Key levels to watch
$93,836.01: Daily high, major resistance and potential H&S head.
$92,266–$92,215 area: First structure resistance / support pivot.
$91,333.95: Potential right shoulder for the bearish H&S.
$88,300.01: Shoulder level of the possible inverse H&S.
$86,286.01 & $80,600.00: Deeper supports; losing these would strongly favour bearish continuation.
Trading Implications
For now we treat Bitcoin as a bearish market in a slow corrective phase, where short setups near the daily high with tight invalidation and longs only from well-defined supports around $91.3k–$86.3k can offer more favourable risk-reward, always adjusted to position size and volatility.
This is not financial advice; always do your own research and manage your risk appropriately.