


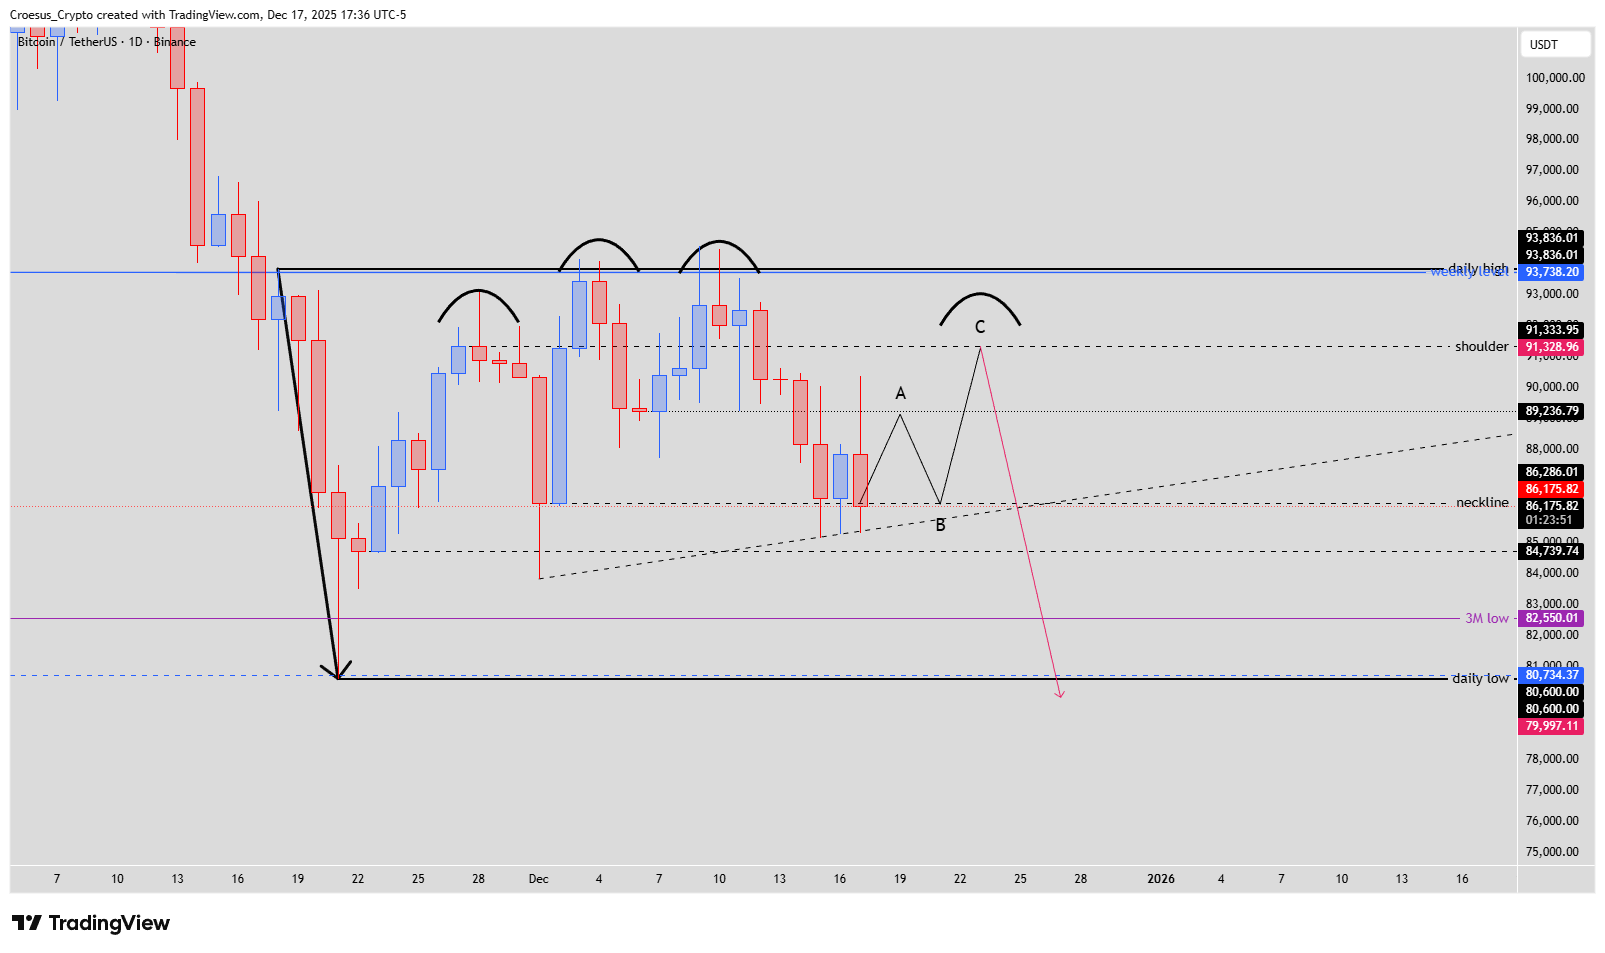
Our Bitcoin daily analysis for 17 December 2025 focuses on a developing head and shoulders structure below the 93.8k daily high. Price bounced impulsively into the A-level, then sold off sharply back toward the neckline in the same session, keeping sellers in control around the mid-80k zone.
Bitcoin daily chart 17 December 2025 with head and shoulders pattern, neckline, rising trendline liquidity and projected bearish continuation.
Technical Analysis Key Points
- today the price tapped the A-level very impulsively, to get rejected within the same daily candle back towards the neckline, printing possibly the B-level.
- we can also see a rising trendline being printed, building up trendline liquidity below it. This is usually a bearish magnet after a bullish move up, which would coincide with the analysis of a head and shoulder pattern.
Market Structure Analysis
In this Bitcoin daily analysis, the broader technical analysis highlights a head and shoulders pattern forming between the neckline near 86.1k and the shoulder zone around 91.3k. The aggressive rejection from A back to the neckline in one candle signals strong overhead supply and suggests that the B-leg of the structure may already be in place.
Price action is now compressing between the neckline and a rising trendline. This trendline creates visible liquidity below it; after a bullish move up, such trendline liquidity often acts as a bearish magnet, aligning with the expectation of a potential breakdown from the head and shoulders pattern.
While no explicit Fibonacci levels are drawn, many traders will look for confluence between these support resistance zones and standard Fibonacci retracements when planning trades.
Key Levels and Scenarios
Bullish scenario: Bulls need to defend the neckline around 86.1k, push back above the A-level, and extend toward 91.3k (projected C / right-shoulder zone). A sustained close above the shoulder area would weaken the topping pattern and open a path back toward the 93.8k daily high.
Key levels to watch
93,836 – daily high and major resistance
91,333 – shoulder / potential C-leg completion zone
89,236 – mid-range resistance and local pivot
86,175 – neckline support resistance, key invalidation level for bears
83,000–80,734 – 3M low and daily low area, main downside targets if neckline breaks
Trading Implications
For active traders, our technical analysis favors short setups while price trades below the shoulder zone, with entries on failed retests of 89k–91k and clear invalidation above 93.8k; position sizing should reflect the distance to those invalidation levels.
This is not financial advice; always do your own research and manage your risk appropriately.