


In this Bitcoin daily analysis for 20 January 2026, we apply the same technical framework used on the TOTAL market cap chart, focusing on the recent break of structure below the prior daily low and the reaction inside the ascending channel. This technical analysis reviews short-term support resistance and the role of Fibonacci confluences.
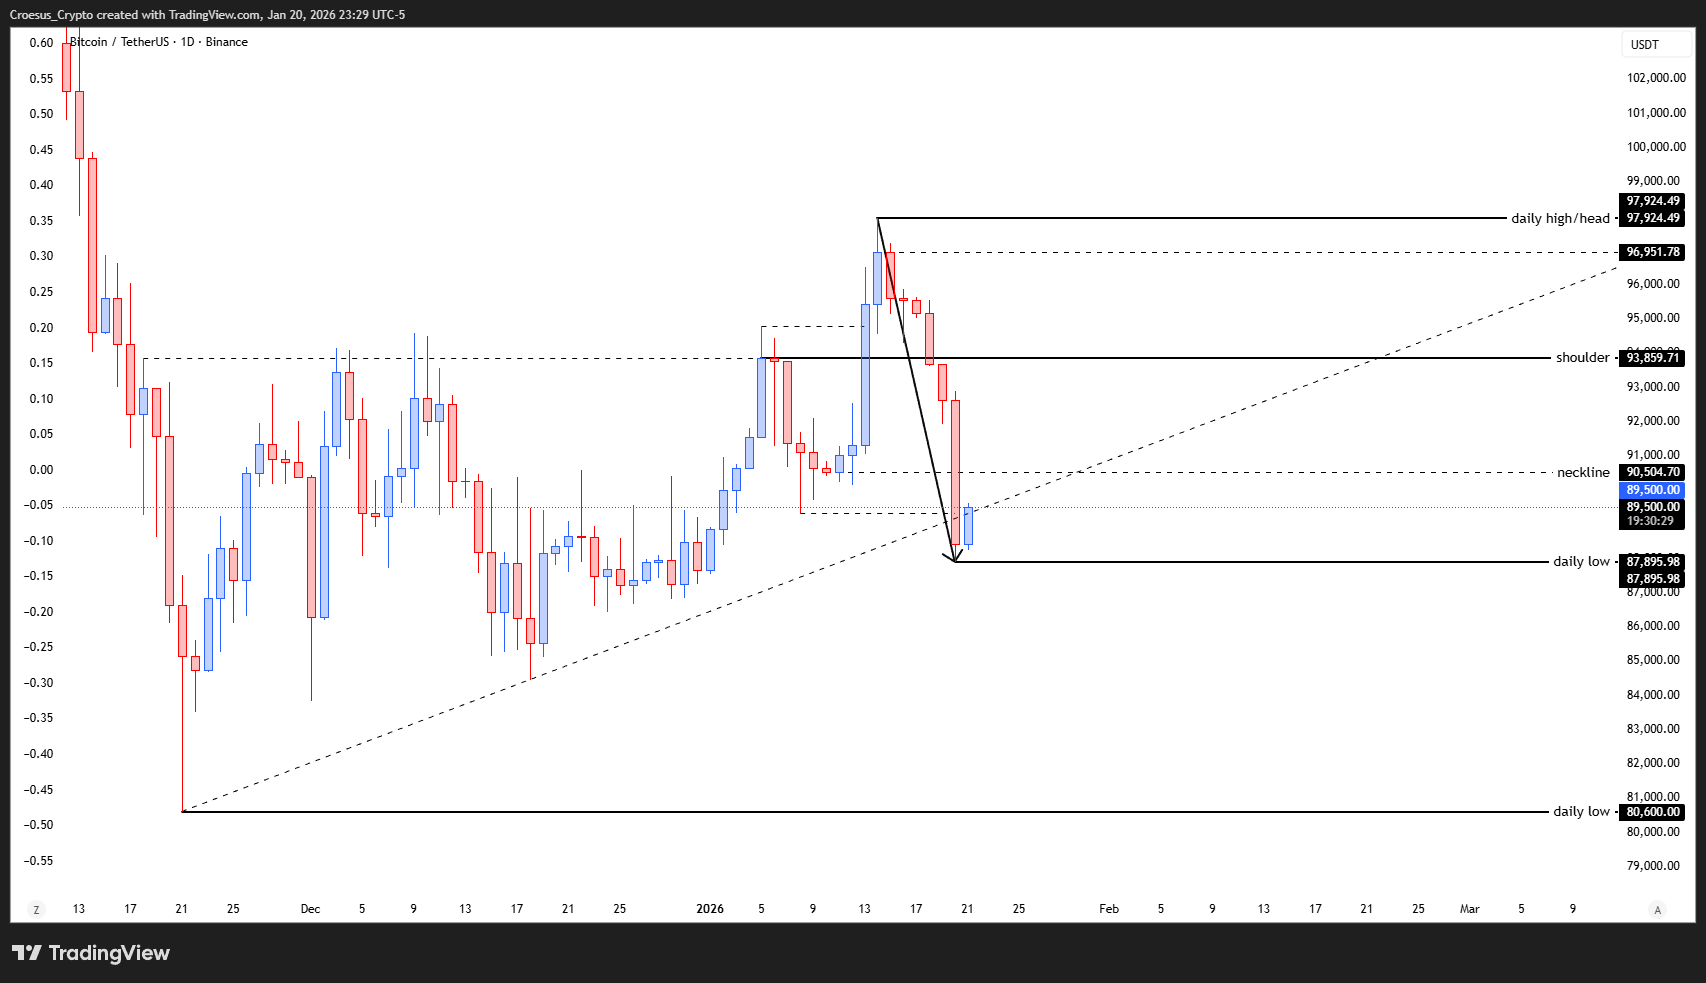
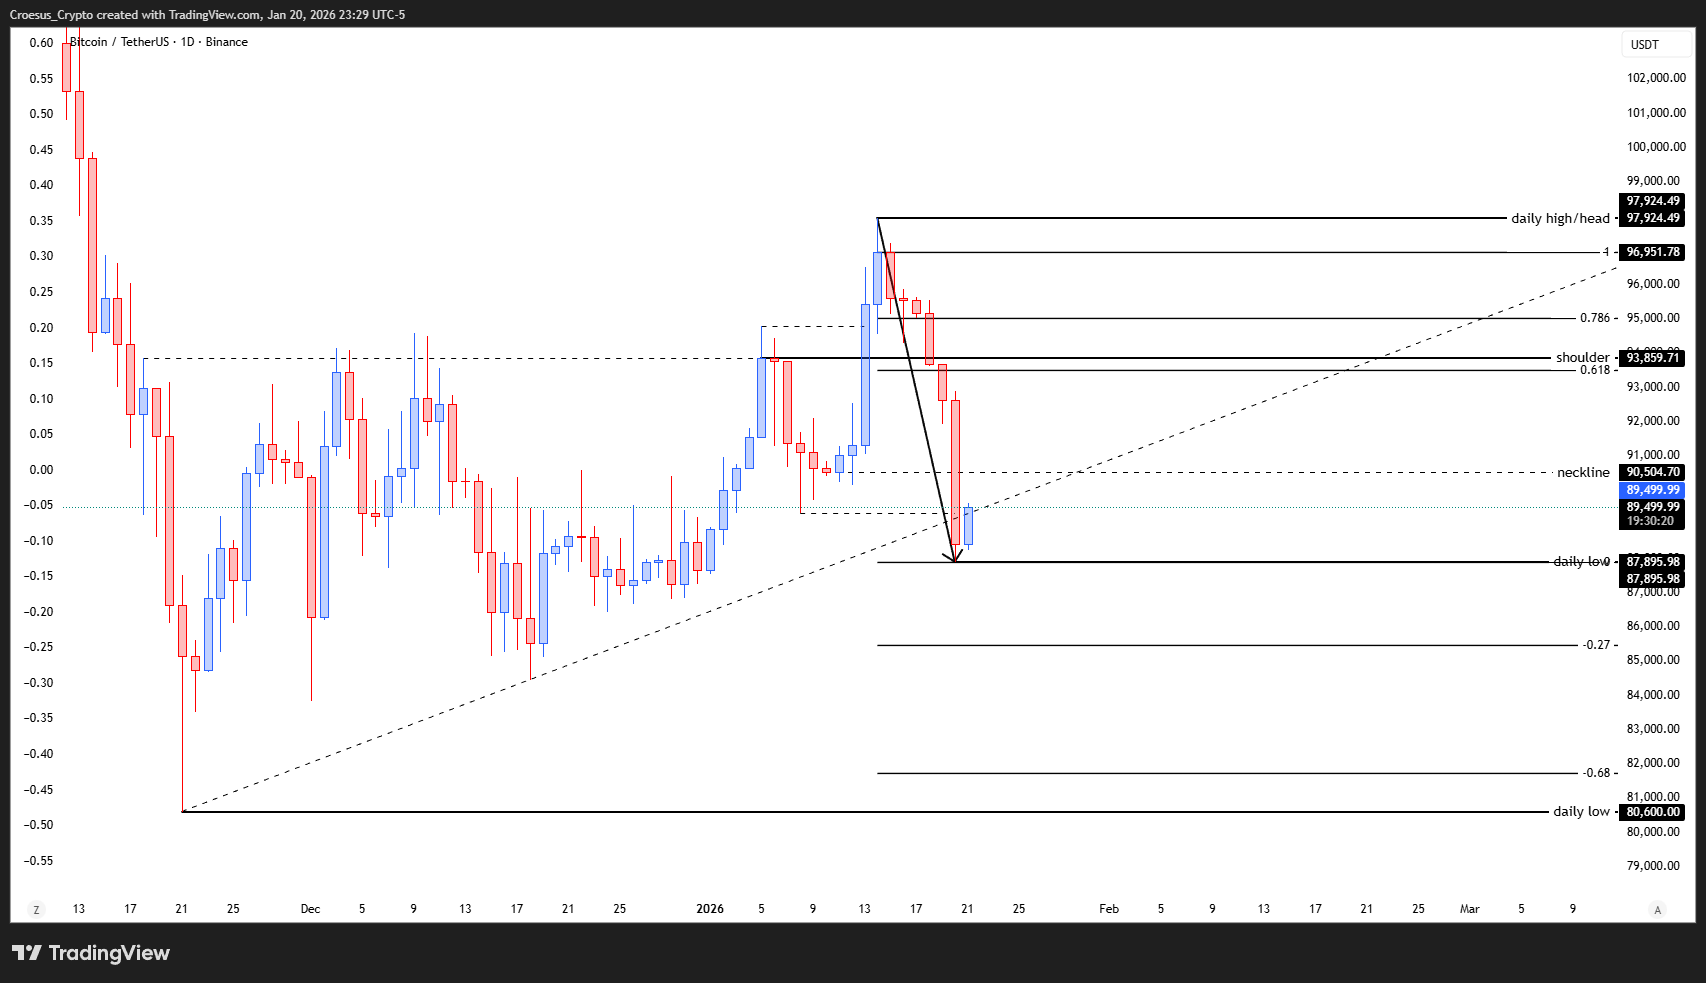
Bitcoin daily chart 20 Jan 2026 showing break of prior daily low, neckline and Fibonacci levels.
Technical Analysis Key Points
- Same analysis as we made on the TOTAL chart : break past the prior daily low.
- Same assumption here : if the last candle closes bullish today, we might see a retracement towards the shoulder level.
- What we notice is that, where the TOTAL gives us very sharp signals, those given by BTC are a bit less exact but nevertheless are correct. The 0.618 is just below the shoulder level and the correction could be all the way to the start of the ascending channel also.
Market Structure Analysis
Structurally, BTC mirrors the TOTAL chart with a decisive move through the prior daily low, confirming short-term bearish pressure. Price is reacting near ascending channel support after a sharp leg down from the “head” / recent daily high. As with TOTAL, any Fibonacci retracement drawn off the current swing remains provisional until today’s candle actually closes bullish; until then, projections from the retrace are only assumptions.
If that bullish close confirms, a retracement towards the shoulder region becomes likely, where the 0.618 Fibonacci retracement sits just below the shoulder level. This creates a strong resistance cluster and potential lower high zone. Failure there would keep the broader correction active and leave room for price to rotate back towards the start of the ascending channel, which often acts as a measured-move target when channels correct more deeply.
Key Levels and Scenarios
Bullish scenario (counter-trend):
A confirmed bullish daily close from current channel support, followed by a retrace into the neckline and 0.618/shoulder area, could offer short-term long opportunities—but within a still-corrective context.
Key levels to watch:
Prior daily low area – recent breakdown point and immediate support-turned-resistance.
Neckline region – mid-range resistance that needs reclaiming to ease bearish pressure.
0.618 retracement / shoulder zone – major resistance confluence and likely seller area.
Recent daily high/head region – upside invalidation for the current corrective structure.
Lower Fibonacci expansion targets – potential completion zones if the downtrend extends.
Trading Implications
For now, we treat BTC as short-term bearish, with any longs considered counter-trend and valid only after a confirmed bullish daily close and with tight risk controls below channel support and key Fibonacci expansion levels.
This is not financial advice; always do your own research and manage your risk appropriately.