


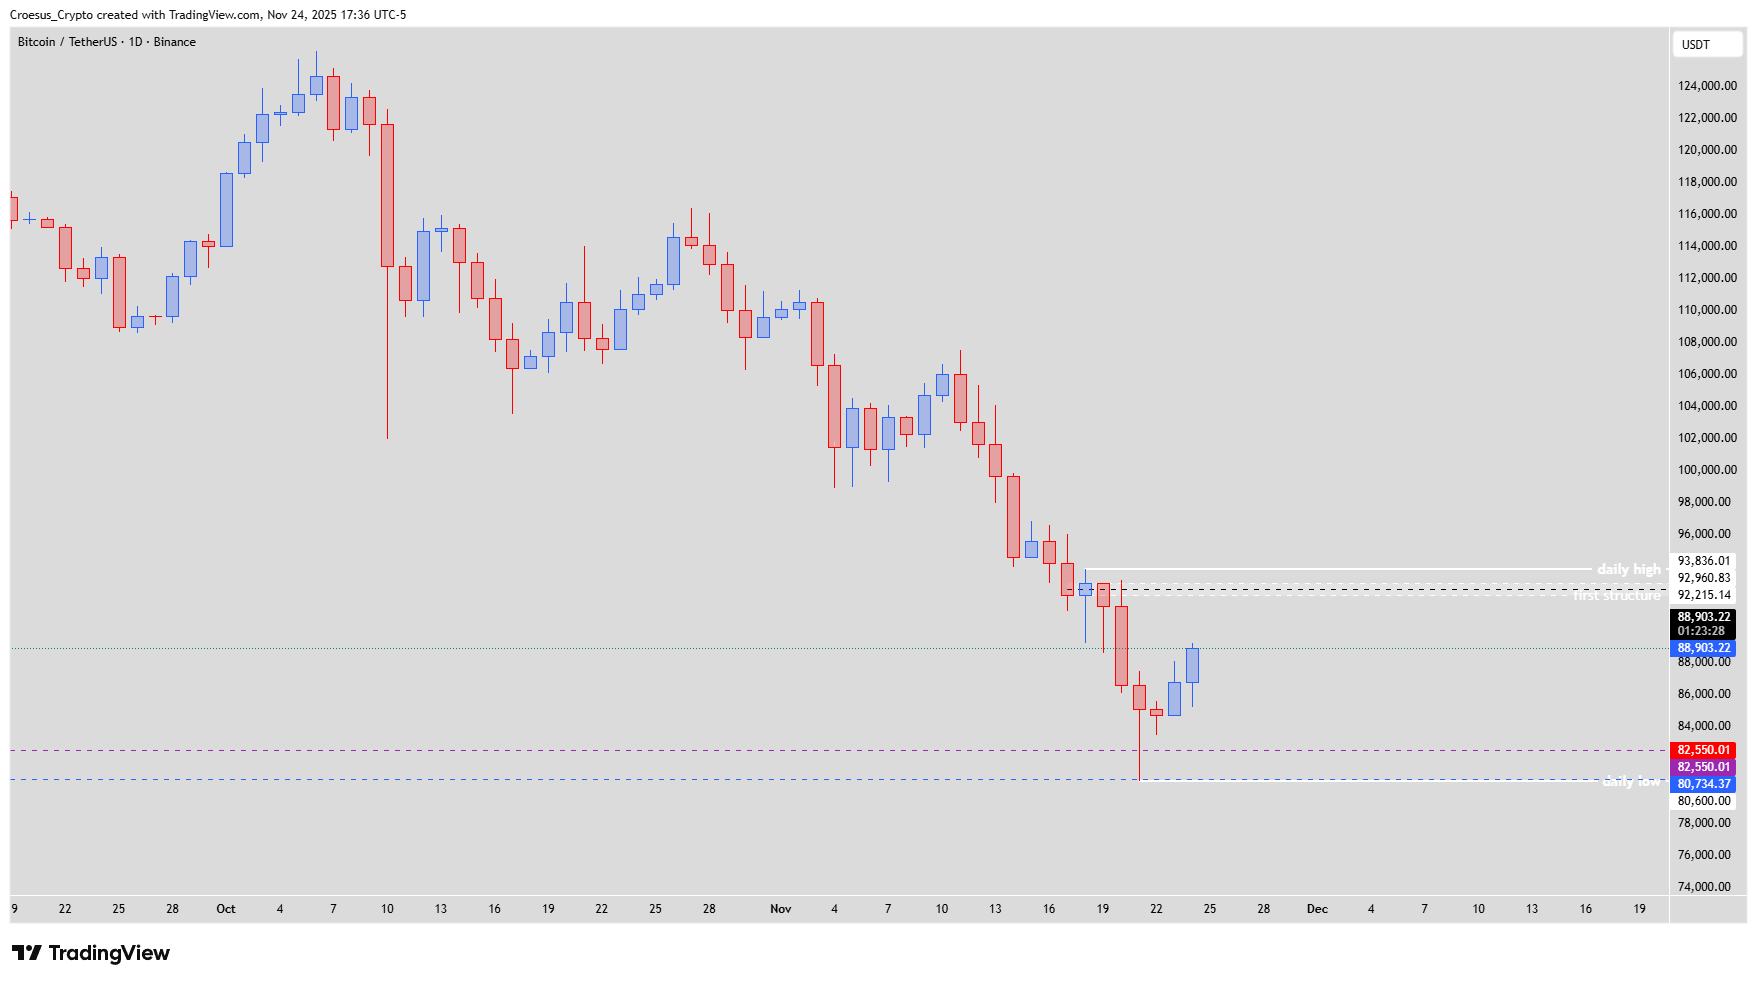
Bitcoin daily analysis for November 2025 focuses on the strong reaction from a 3M/M/W key support level and the follow-through seen today. Our technical analysis indicates that, despite the bounce, the broader structure still leans bearish and current price action should be treated as a corrective move within the dominant downtrend.
Bitcoin daily chart November 24 2025 with 3M/M/W keylevel support, corrective bounce and resistance at 92,215 $ and 93,836.01 $.89253.78 and resistance zone around 93–96k.
Trend = bearish ↓
Technical Analysis Key Points
- After hitting a 3M/M/W keylevel, price showed a bullish reaction. Today we saw a bullish continuation.
- Eventhough price hit some key supportlevels, there is still a bearish bias. To get a bullish bias price needs to break the daily high and defend this level @ 93,836.01 $
- As long as there is no bullish reversal, we need to treat this bullish move as a correction of the last bearish leg down. Price could react bearish when hitting the 92,215 $ level.
Market Structure Analysis
The recent leg down pushed Bitcoin into a strong 3M/M/W support zone, where buyers finally stepped in and printed a sharp rejection wick followed by today’s continuation candle. This confirms the area as a key support resistance pivot, but it does not yet invalidate the series of lower highs and lower lows. As long as price trades below the daily high at 93,836.01 $, our technical analysis keeps a clear bearish bias. The current advance likely retraces part of the last impulsive sell-off rather than starting a new macro uptrend. While we do not see explicit Fibonacci confluence highlighted here, the reaction from a major higher-timeframe level is enough to justify treating this move as a corrective rally within the broader bearish context.
The lack of a clear momentum shift—especially after a multi-week decline—reinforces the need for caution. Bulls must reclaim structure; until then, lower-timeframe bullish candles should be treated as corrective rather than trend-changing.
Key Levels and Scenarios
Bullish scenario: a clean breakout and hold above 93,836.01 $ would signal a potential reversal, shifting our Bitcoin daily analysis toward a constructive outlook and opening room for a larger recovery swing.
93,836.01 $ – Daily high; must break and hold to confirm a bullish bias.
92,215 $ – First structure where price could react bearish and resume the downtrend.
3M/M/W keylevel (current low zone) – Major higher-timeframe support that triggered the bounce.
Prior local lows – Any failure back below this zone would confirm sellers in control and invalidate a sustained bullish reversal.
Trading Implications
While price respects the 3M/M/W keylevel but remains capped below 92,215 $–93,836.01 $, we view the risk/reward as favoring patience or tactical shorts into resistance rather than chasing the relief rally, with clear invalidation only once the daily high is reclaimed and defended.
This content is for educational purposes only and does not constitute financial advice.