

In this Bitcoin weekly analysis for week 2 January 2026, we see a strong bearish impulse down from the highs, followed by slowing downside momentum that hints at a possible bullish corrective phase. Price currently trades just above the local range highs, while the yearly level overhead still acts as key resistance in our technical analysis.
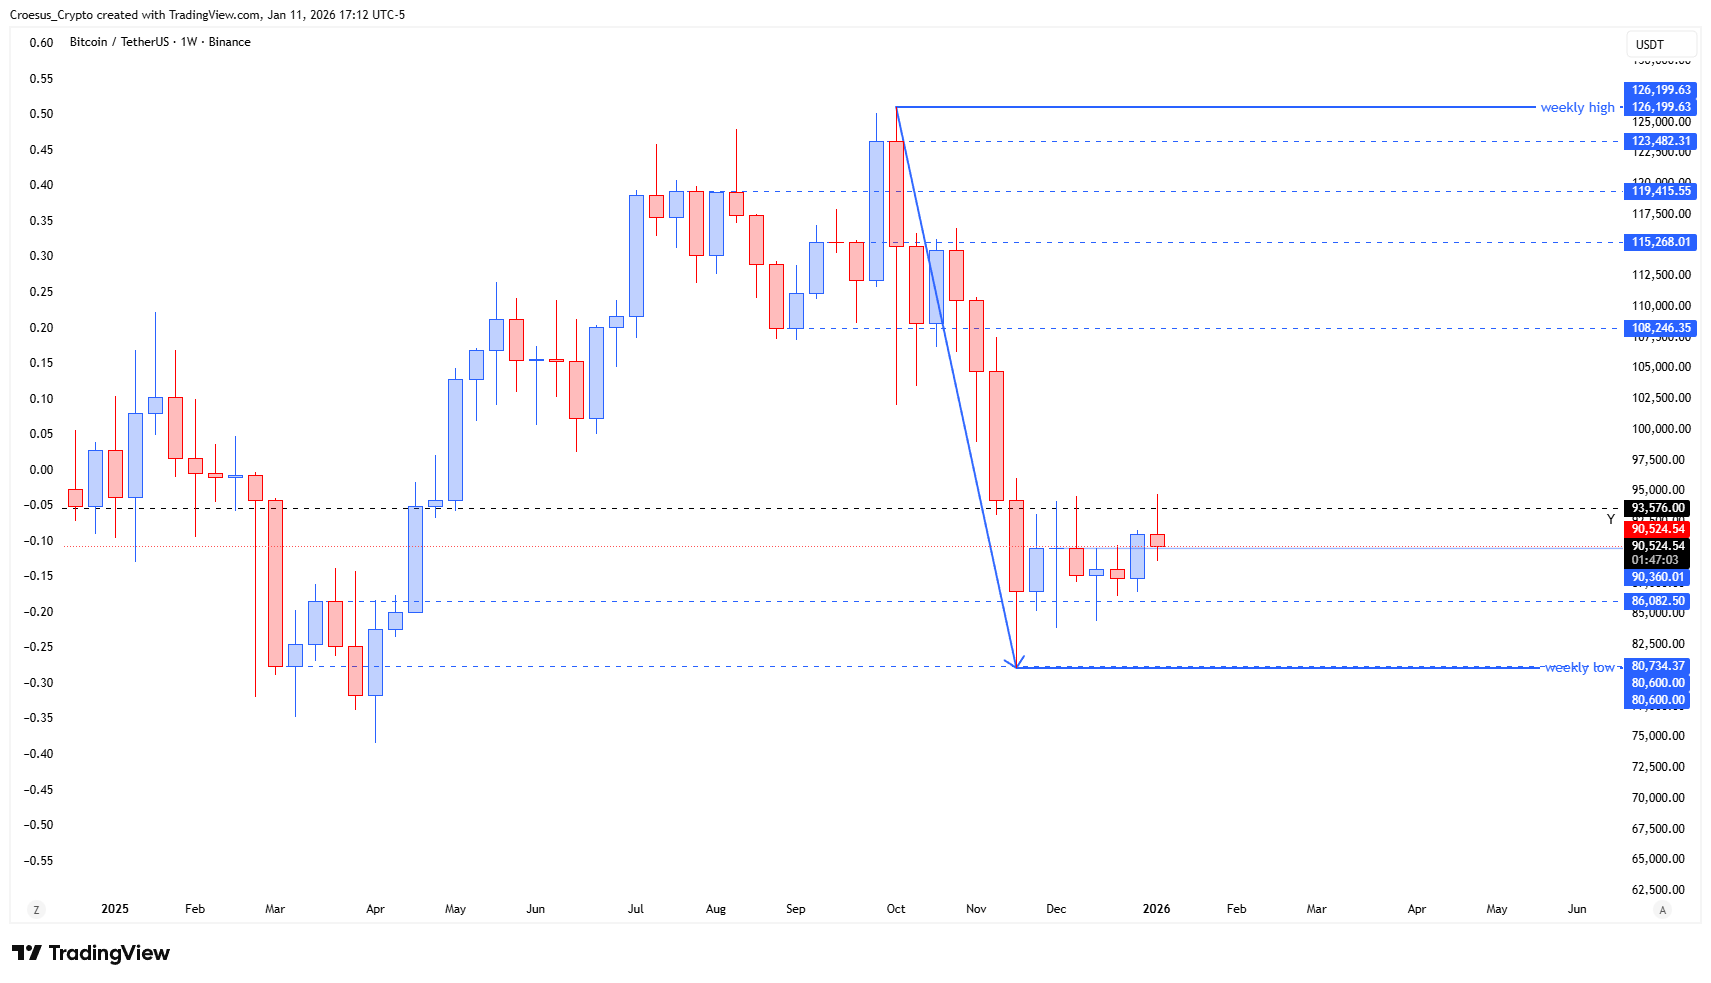
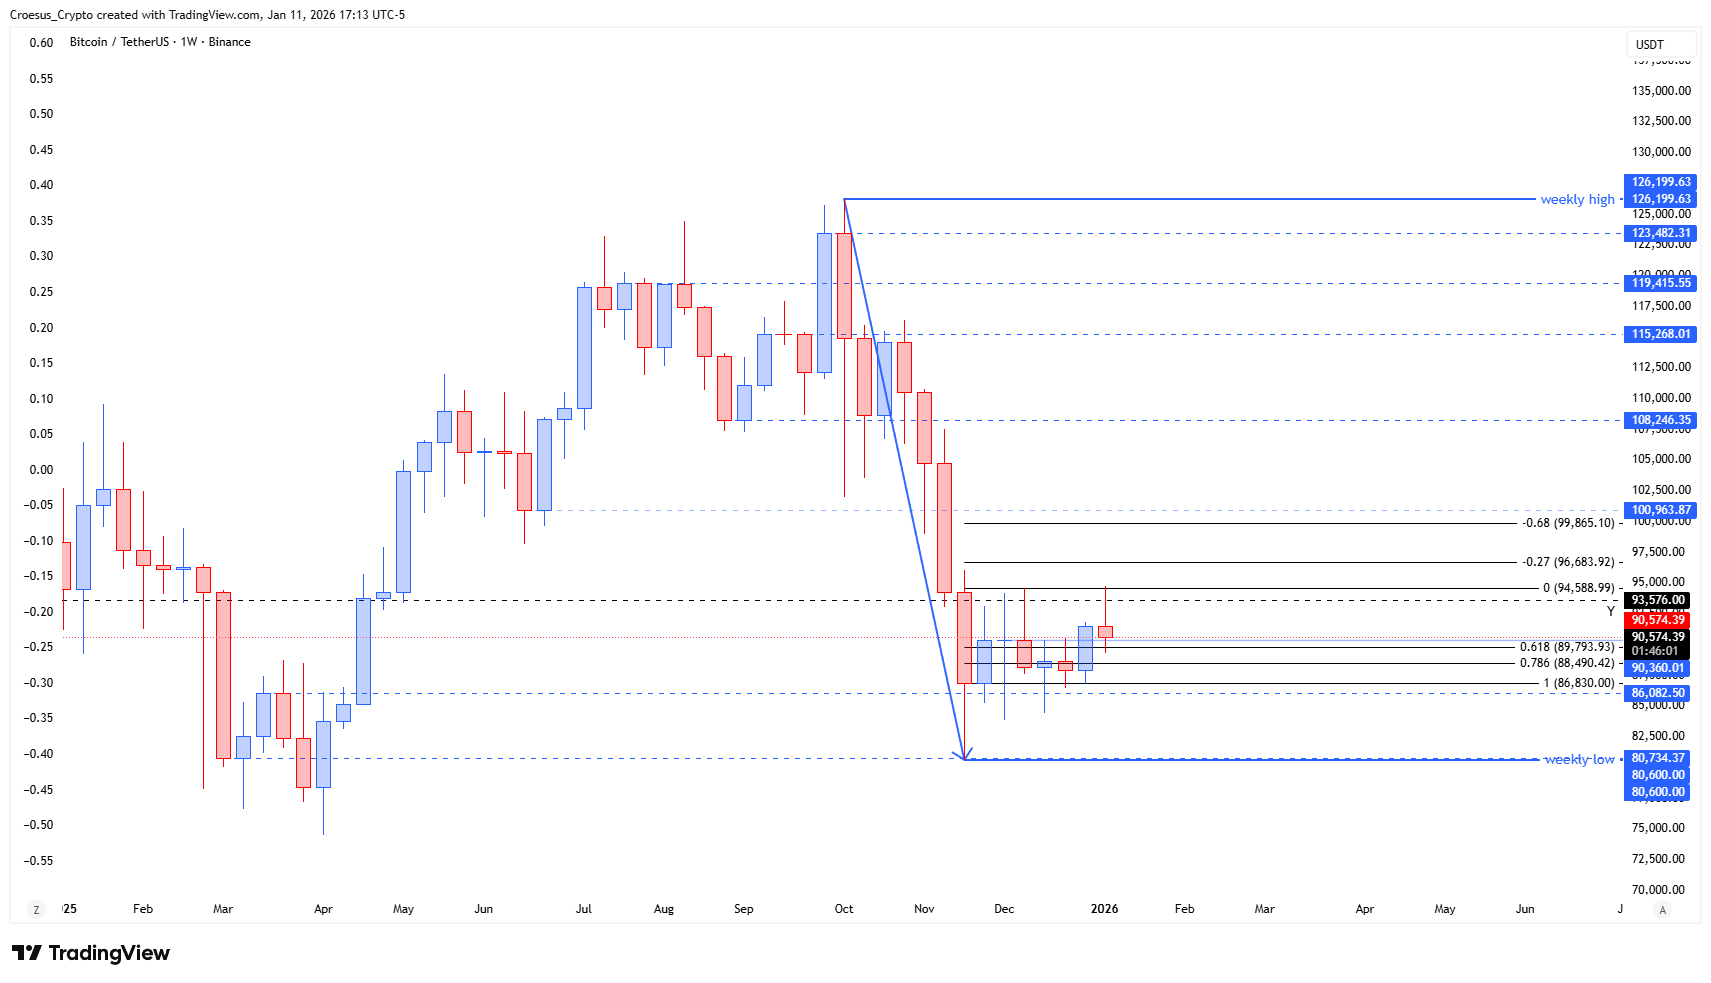
Bitcoin week 2 January 2026 with support resistance, yearly level and Fibonacci projections.
Technical Analysis Key Points
- This is nearly a copy conform of the TOTAL weekly chart. Only the levels aren't as clear here.
- We could see price making the same bearish impulse. At this moment price slowed down and could see a possible start of a bullish corrective move.
- The price stayed hovering for five weeks between the low @ $86.830,00 and $90.395,31
- Last week price broke above this last level and was retested succesfully during this week.
- We still have the yearly high which acts as resistance at this moment. If look left to April 2025, we can see that we broke through the yearly level, retested it and then started a major move up.
- if we break and retest this level, we see our first resistance at $100.963.
Market Structure Analysis
Our Bitcoin weekly analysis highlights a clear bearish leg into the current base around the weekly low near $86,830, followed by a five-week consolidation range. The breakout above $90,395 and successful retest this week confirm that this range has flipped from resistance into short-term support, an important support resistance shift.
Structurally, Bitcoin now trades between this reclaimed range high and the yearly level acting as overhead resistance. The last time price broke and retested this yearly level (April 2025), it initiated a strong impulsive rally. If we see a similar break-and-retest pattern now, it would support the view that the current move is transitioning into a larger bullish corrective phase. Fibonacci retracement and extension levels line up with the $100,963 zone, adding confluence to that area as the first major upside target.
Key Levels and Scenarios
Bullish scenario:
If price continues to hold above $90,395 and then cleanly breaks and retests the yearly level, a corrective advance toward the $100,963 resistance becomes likely, with potential extension higher if momentum accelerates.
Key levels to watch:
$86,830 – Weekly low and range base; loss would revive the primary bearish impulse.
$90,395 – Reclaimed range high; must hold as support to sustain the corrective bias.
Yearly level (~$93k–$94k) – Major resistance; break and retest needed to unlock higher targets.
$100,963 – First significant resistance above the yearly level with Fibonacci confluence.
Trading Implications
Traders can view the $90,395 area as a potential demand zone within a broader downtrend, with invalidation below $86,830 and upside targets at the yearly level and then $100,963, always sizing positions conservatively given the still-bearish higher-timeframe context.
This analysis is not financial advice; always do your own research and manage your risk before trading.