BTC Marketcap / Bitcoin
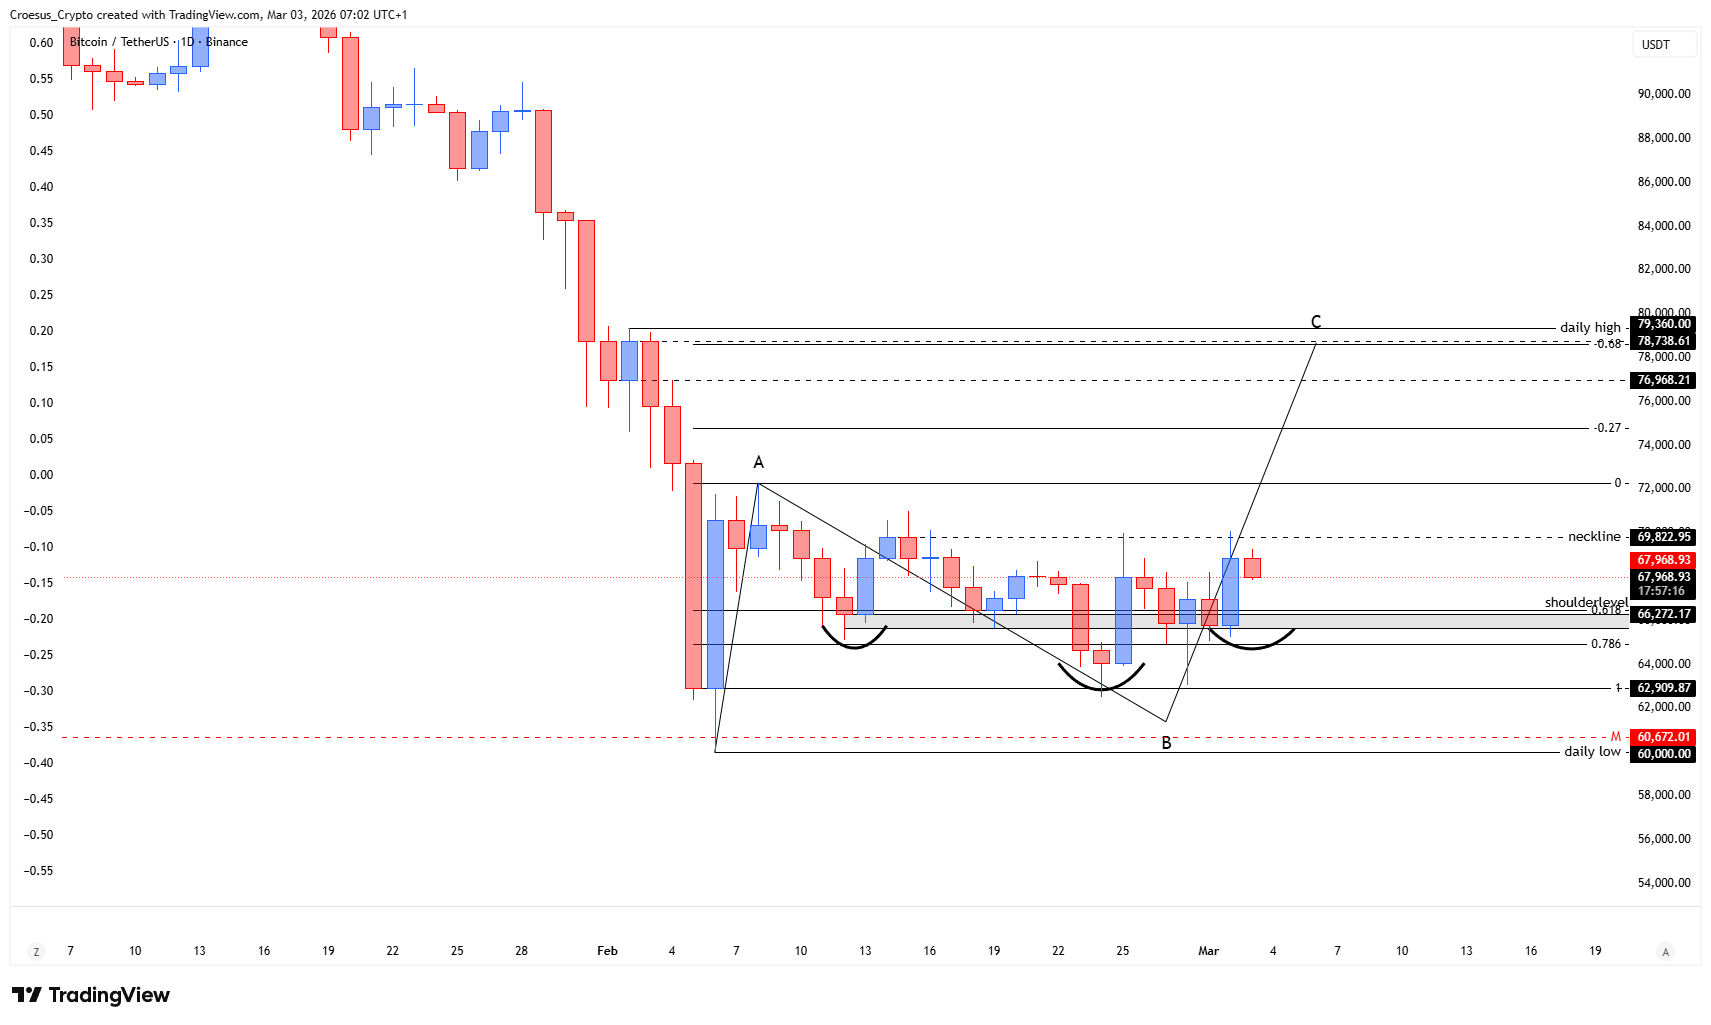
BTC daily analysis 02/03/2026. Bitcoin is trading in a fragile corrective structure where bears still control the broader move, while price action attempts to stabilize around key support resistance defined by the neckline and the shoulderlevel.

- BTC retested the shoulderlevel during the weekend but it did not get respected fully (close below the level)
- This potentially indicates us that after a retest or a break of the neckline (which we saw today) we could retest the shoulderlevel again, just in order to respect it and confirm it as support.
- When revisiting the shoulderlevel we want to zoom in on the 4H timeframe in order to decide on an entry pattern.
- This set-up is still higher risk. As long as the neckline is not broken (confirmed close above the neckline), we don't have a confirmation of the move. At this moment the price is turning but has turned completely yet. Notice the difference.
Market Structure Analysis
Our BTC daily analysis focuses on the interaction between the neckline and the shoulderlevel as the defining market structure. The weekend close below the shoulderlevel signals that support is not yet accepted, which keeps the structure vulnerable to additional downside or another liquidity sweep.
Today’s neckline event reads as a key reaction point: if this move is only a partial turn, price can still rotate back into prior demand to “properly” retest and potentially reclaim the shoulderlevel.
Structurally, that would look like a corrective pullback followed by confirmation (acceptance) rather than a single-touch bounce. Until the market shows acceptance back above the neckline, the broader bearish bias remains intact, and any long-side idea sits in a counter-trend context.
Key Levels and Scenarios
In this Bitcoin technical analysis, the neckline is the primary trigger for confirmation, while the shoulderlevel is the main retest zone traders will watch for support resistance behavior. A bearish continuation remains in play if price fails to reclaim the neckline convincingly, while a more constructive scenario requires a confirmed close above the neckline followed by holding structure on any pullback.
- Neckline: needs a confirmed close above for reversal confirmation
- Shoulderlevel: key retest zone; prior close below suggests it is not yet respected
- Neckline retest area: likely decision point for acceptance vs rejection
Trading Implications
This is a higher-risk environment because structure is not confirmed. Conservative approaches typically wait for a confirmed close above the neckline and then a clean retest/hold, while aggressive approaches focus on lower timeframe confirmation (4H) at the shoulderlevel with tight invalidation based on structure.
This analysis is for informational purposes only and does not constitute financial advice.