


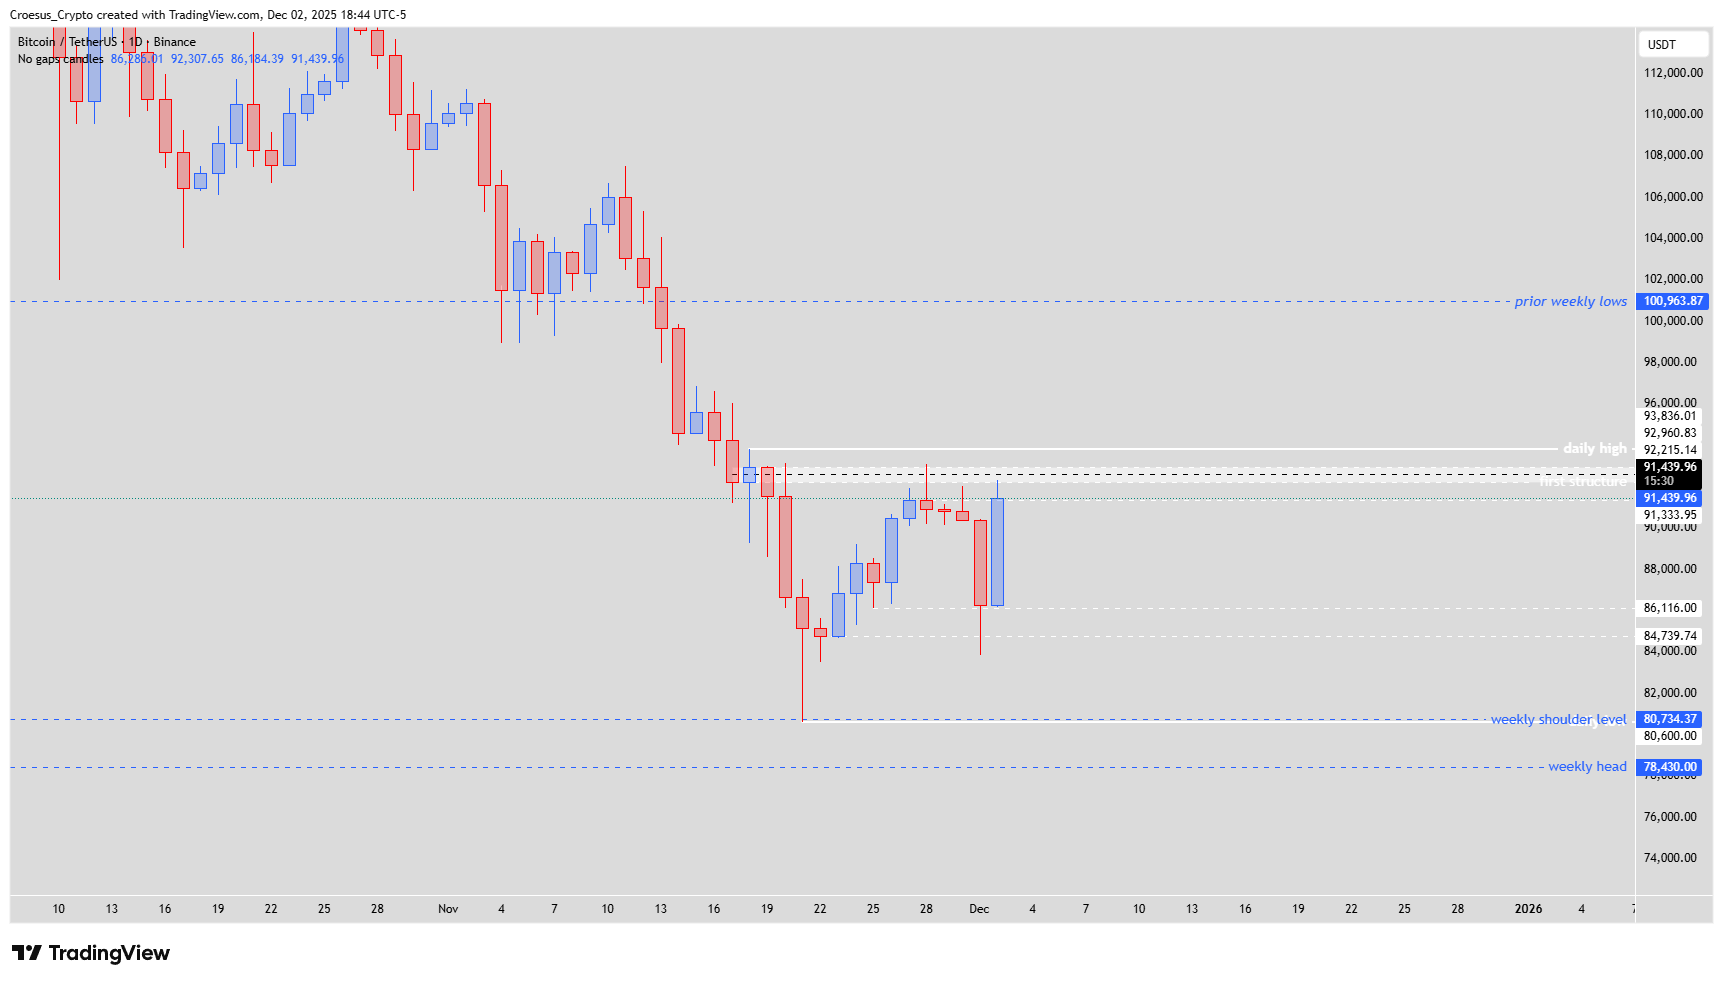
In this BTC daily analysis for 03 December 2025 we see the first clear bullish response after price revisited the recent range lows. BTC printed a strong impulsive candle that erased several prior red sessions, signalling a short-term momentum shift while still trading inside a broader bearish structure. Our technical analysis focuses on how price reacts between the IC-level support and the untested daily resistance that defines the current support resistance range.
Trend = bearish ↓
Technical Analysis Key Points
- Yesterday the price retested the range lows, but this action was followed by the first impulsive bullish candle, correcting the last 4 bearish candles. This is a switch of momentum, indicating that bulls are willing to take over power.
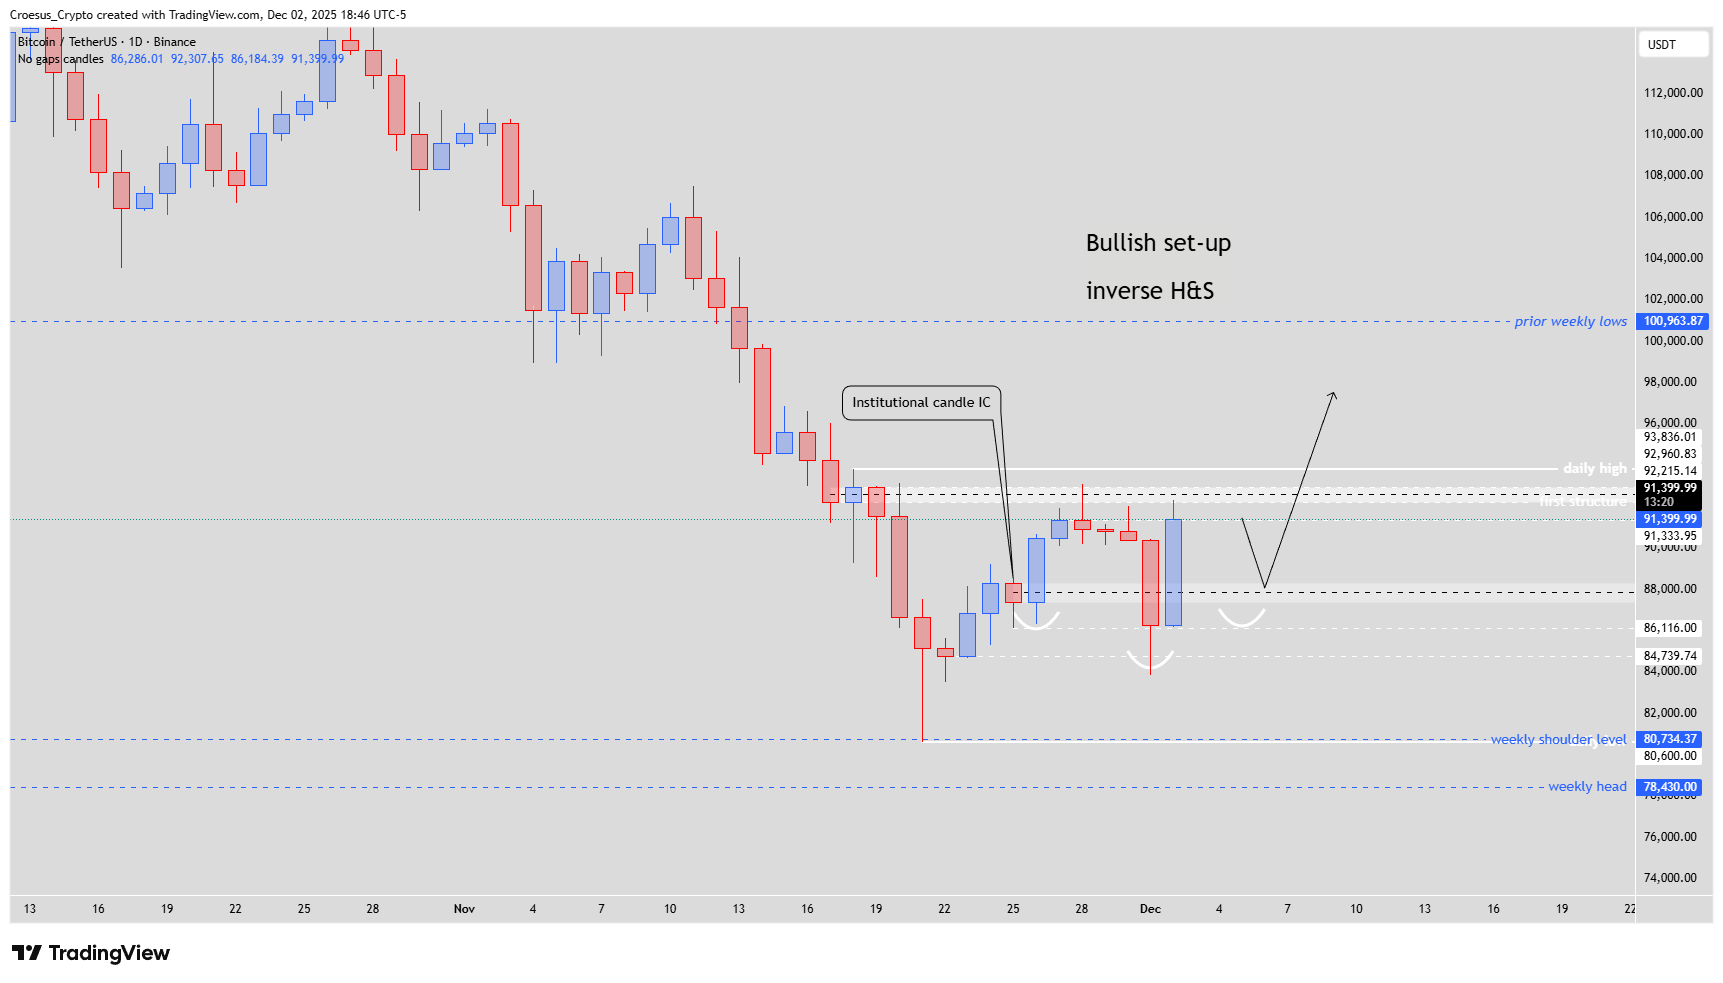
- Bullish set-up : we have a switch of momentum. If price corrects towards the IC-level we could see the formation of a inverse head and shoulders pattern, where the IC-level would act then as the shoulder level. During an eventual retrace we will be watching the price action at this level.
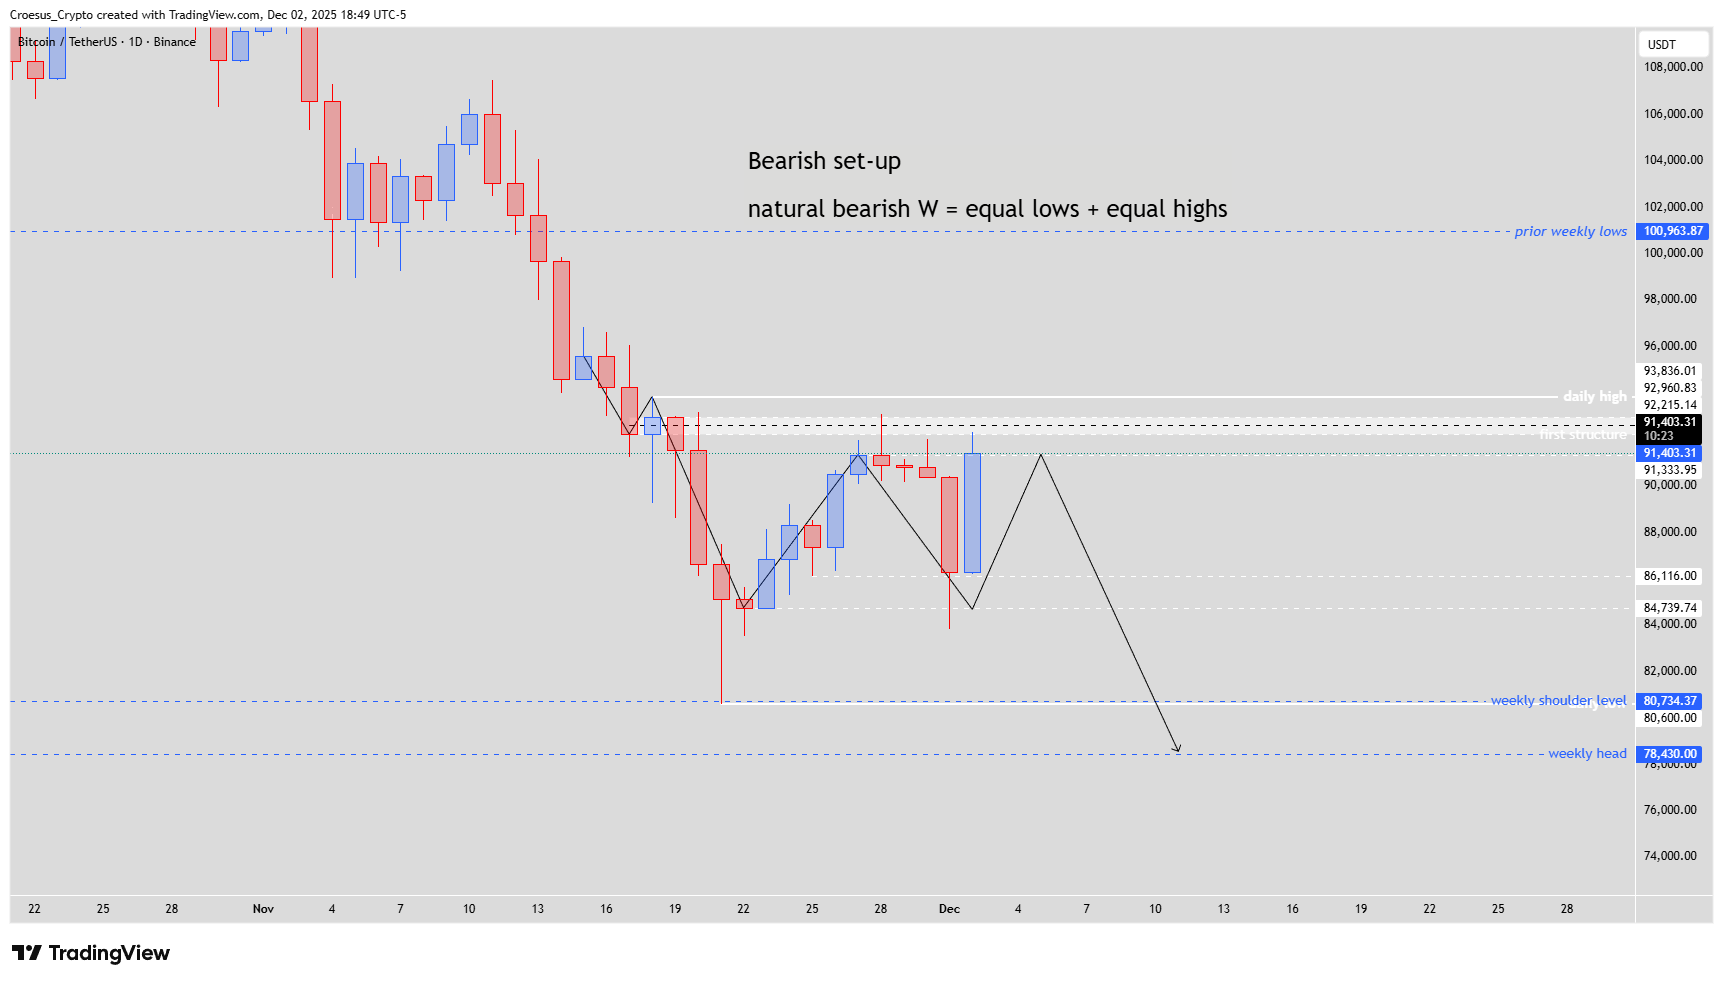
- Bearish set-up : market structure is still predominantly bearish, the daily still isn't broken, not even touched. This means that price possibly prints a natural bearish W. This means that after a bearish W, price prints equal lows and equal highs, confirming the first bearish W.
Market Structure Analysis
BTC remains in a dominant downtrend on the daily timeframe, but yesterday’s rejection of range lows and today’s bullish impulse show that buyers are attempting to reclaim short-term control. If price pulls back into the IC-level and holds, that zone can carve out the “shoulders” of an inverse head and shoulders pattern and trigger a more meaningful corrective phase higher.
On the other hand, daily resistance above is still untouched; the bears keep structural control as long as that level caps price. Failure to break it after this momentum spike would fit the natural bearish W scenario, where BTC forms equal lows and equal highs around the same band, strengthening the original bearish W and potentially setting up another leg down. Traders can later overlay Fibonacci levels once a clean swing structure is confirmed, but for now the key battle is purely structural.
Key Levels and Scenarios
Bullish scenario: A controlled retrace into the IC-level that holds as support, followed by higher lows and a neckline break, would validate the inverse H&S and open room for a deeper corrective rally within the larger trend.
Critical levels to watch:
Range lows: recent demand zone that sparked the impulsive bounce.
IC-level: potential shoulder and main intraday support; loss of this weakens the bullish reversal case.
First structure zone: mid-range area where rejection would hint at renewed selling pressure.
Daily resistance/highs: untested supply; failure here favours the natural bearish W.
Equal highs/equal lows band: if recreated, it confirms continuation of the original bearish W pattern.
Trading Implications
From a trading perspective we see an asymmetric decision point: aggressive bulls may look for confirmation at the IC-level with tight risk, while bears will be more interested in short setups if BTC stalls below daily resistance and starts to trace out equal highs and lows, always adapting position size to volatility and personal risk tolerance.
This content is for educational purposes only and is not financial advice; always do your own research before making any investment or trading decisions.