


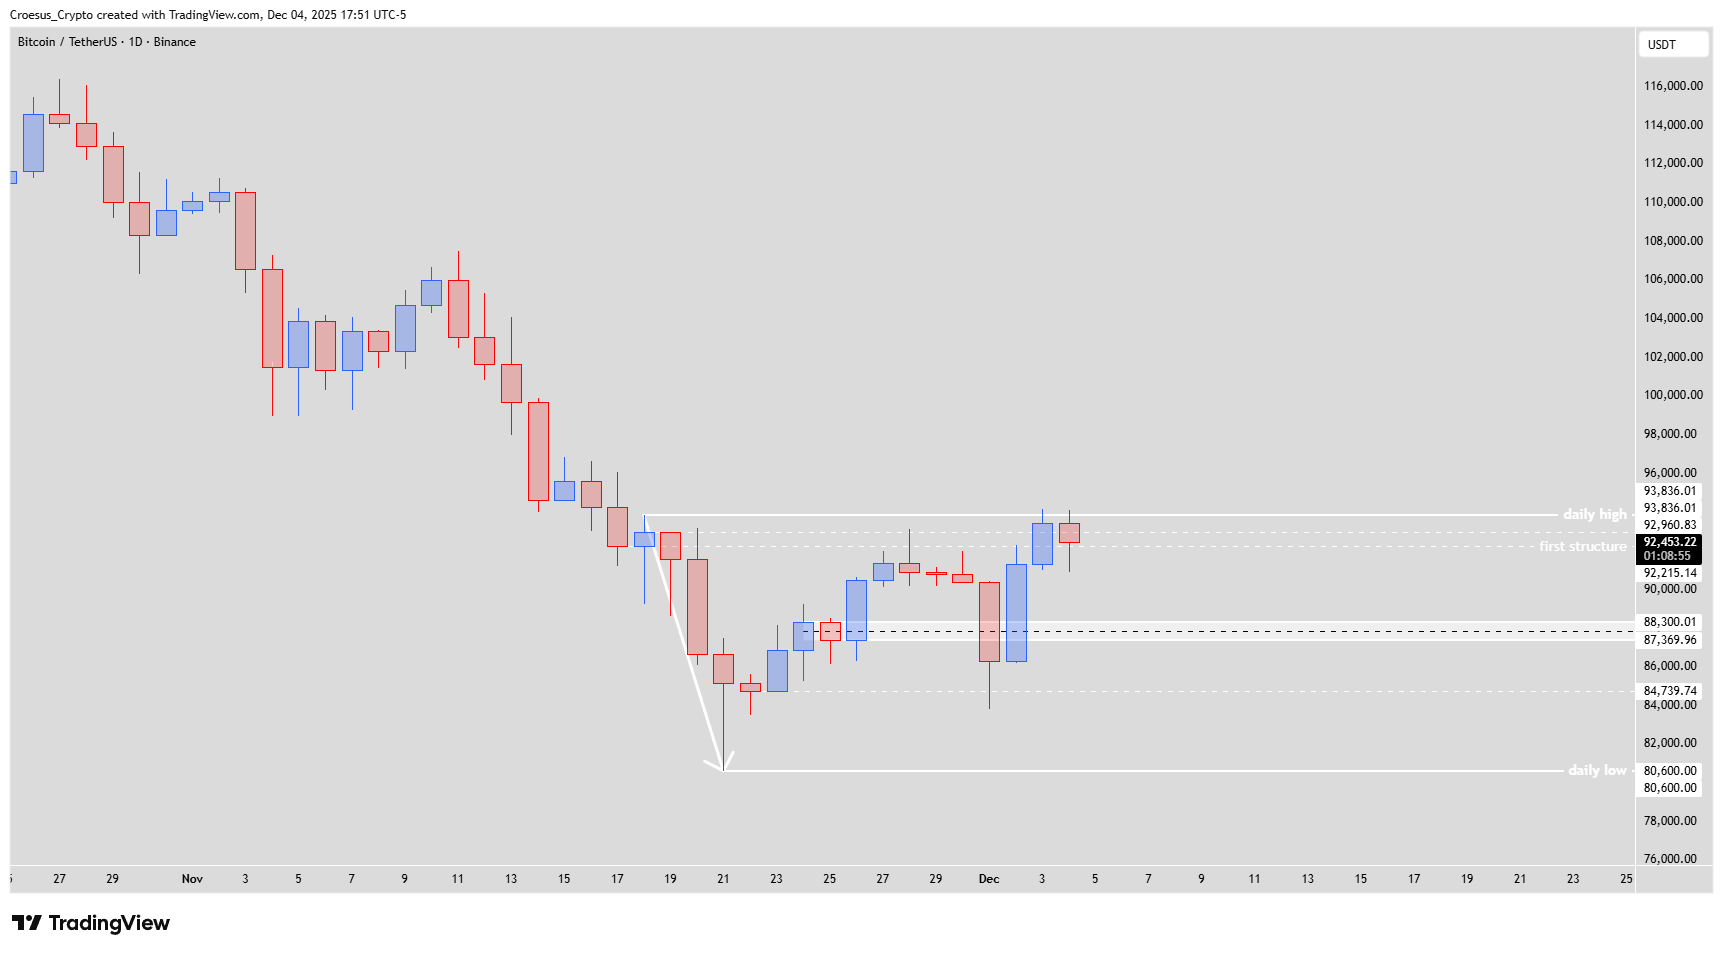
In this Bitcoin daily analysis for early December 2025, we see price rejecting the same daily high for a second time while finding short-term support at the first structure. Our technical analysis focuses on the competing bearish and bullish structures that are forming around the IC-zone, which now acts as the main decision and support resistance area.
BTC daily chart 4 Dec 2025 showing broader downtrend, daily high, first structure support and daily low.
Trend = bearish ↓
Technical Analysis Key Points
- After touching but not breaking the daily high yesterday, the price retested that high, followed by a rejection. The price found some support on the first structure.
- As the daily high was not broken yet, both set-ups remain in play. The IC-zone could be the zone of decision.
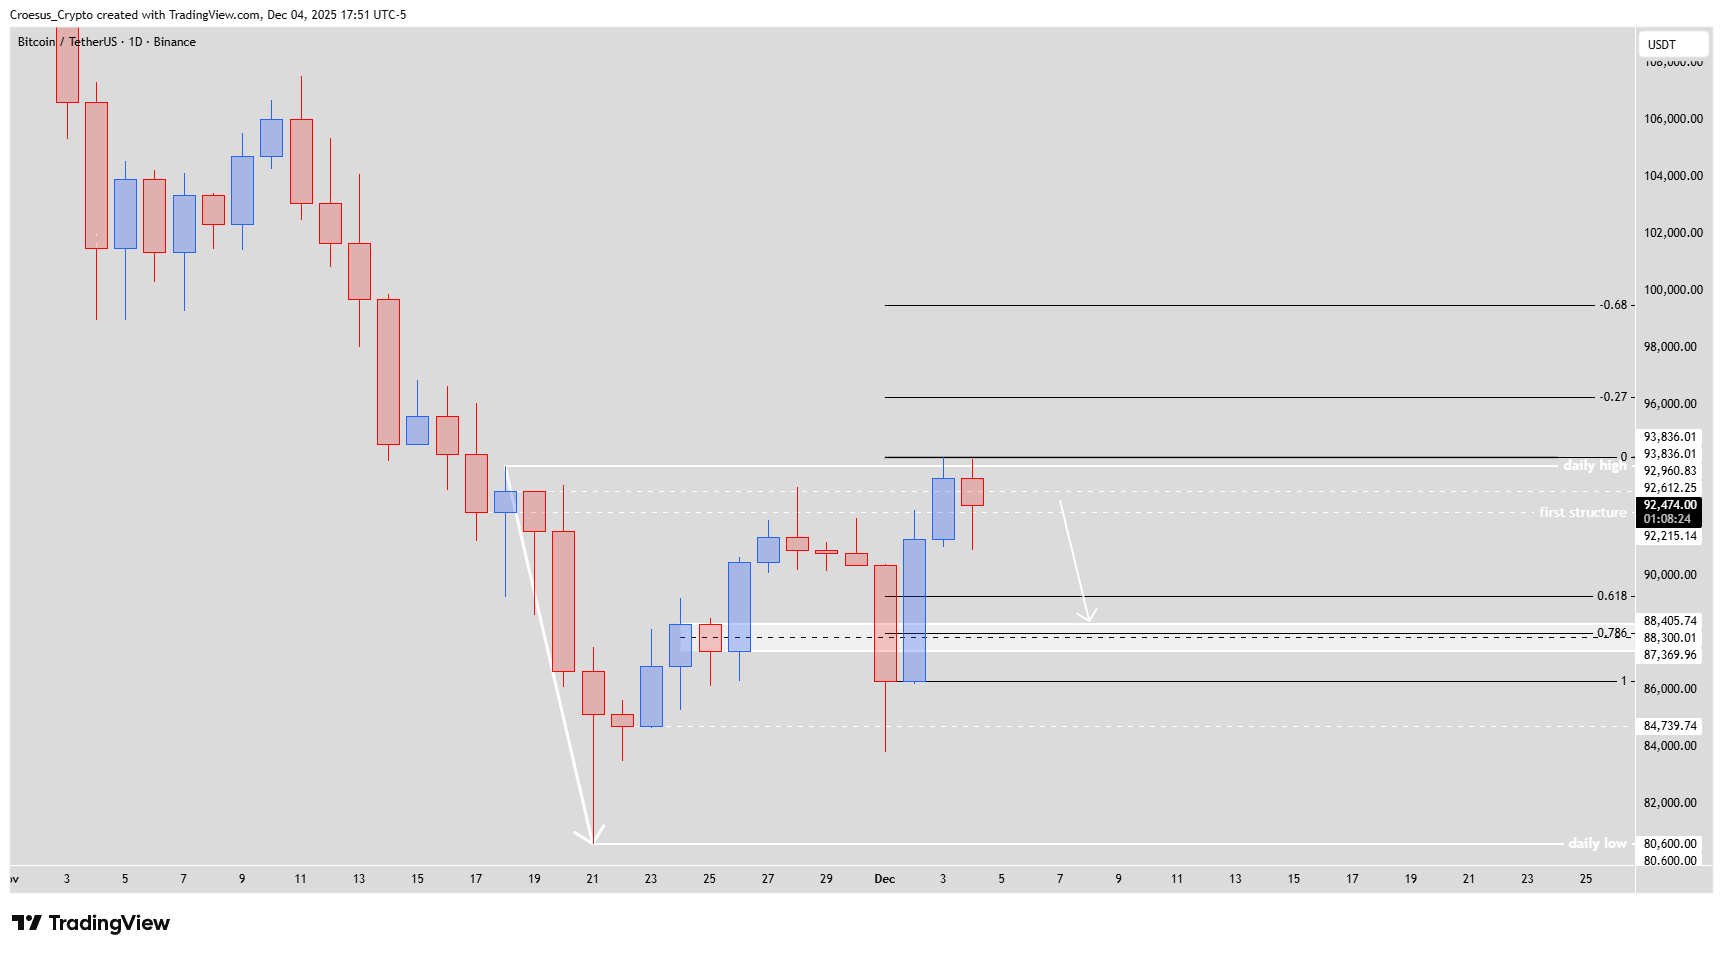
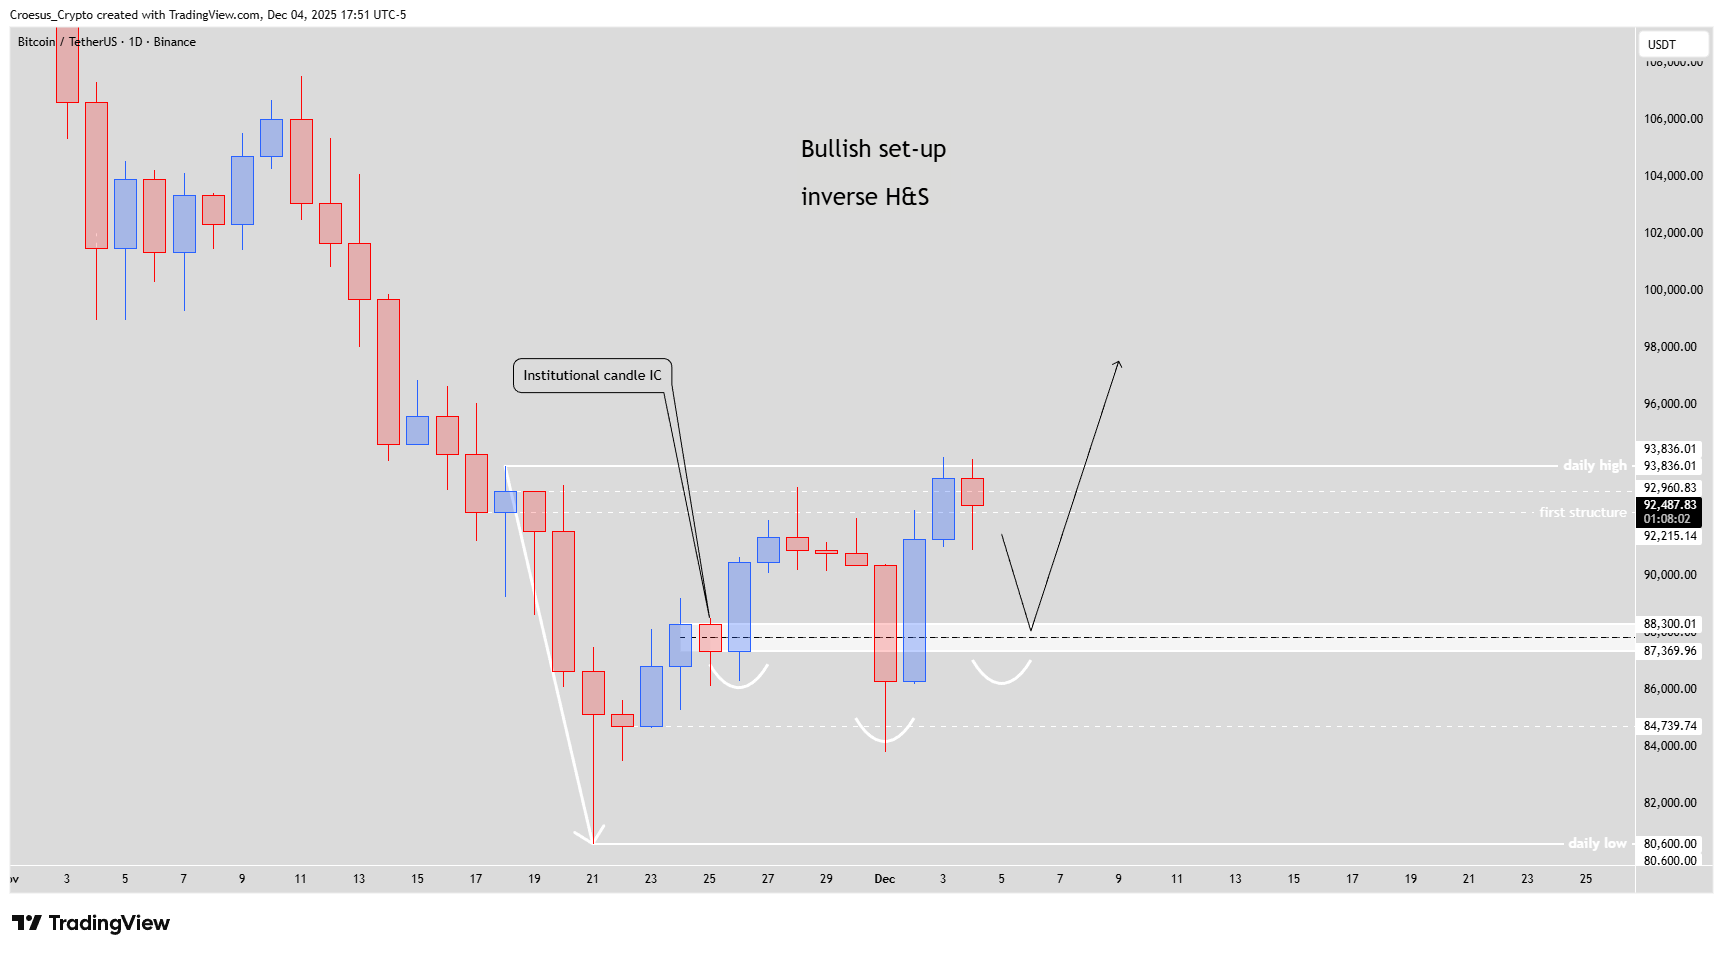
- Bullish set-up : we have a switch of momentum. If price corrects towards the IC-level we could see the formation of a inverse head and shoulders pattern, where the IC-level would act then as the shoulder level. During an eventual retrace we will be watching the price action at this level.
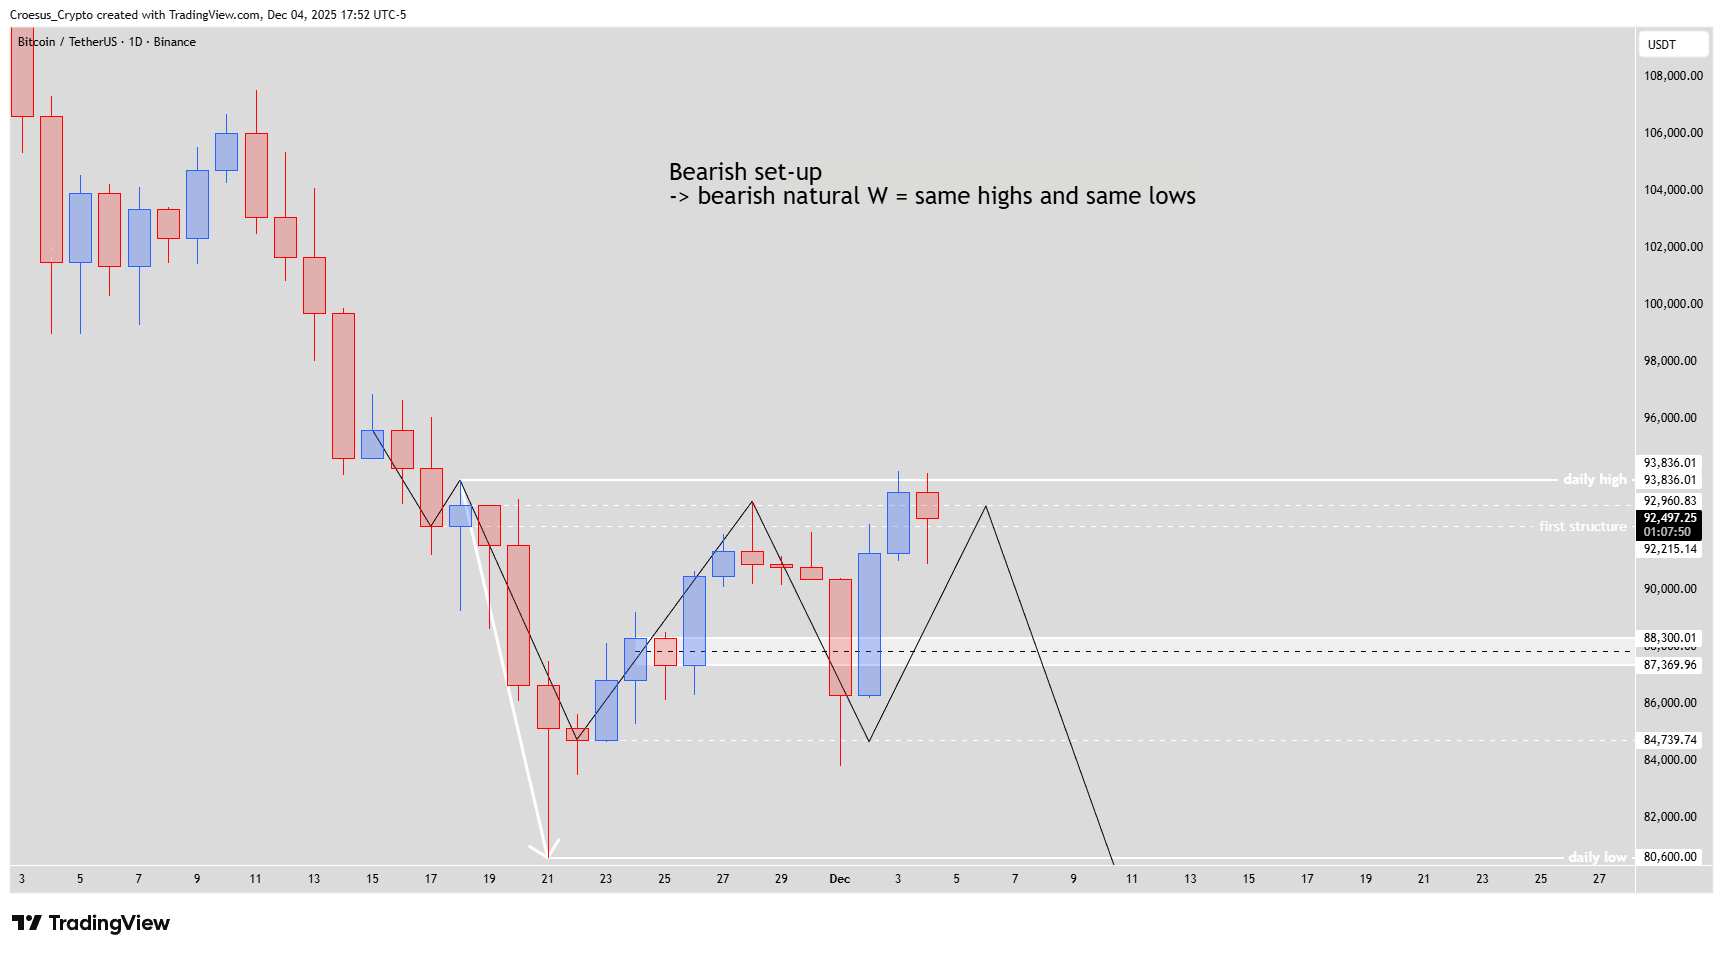
- Bearish set-up : market structure is still predominantly bearish, the daily still isn't broken, not even touched. This means that price possibly prints a natural bearish W. This means that after a bearish W, price prints equal lows and equal highs, confirming the first bearish W.
Market Structure Analysis
Our Bitcoin daily analysis keeps the broader trend clearly bearish: the daily high remains unbroken, so downside structure is still in control. The latest rejection confirms that level as firm resistance, while the first structure and IC-zone act as layered support. As long as price trades between these zones, we are in an area of indecision where a shift in momentum could trigger a reversal.
If buyers defend the IC-level and form an inverse head and shoulders, that would signal a potential trend change, especially on a breakout above the neckline and eventually a close above the daily high. If bears step back in from current levels or after a shallow bounce and drive price lower, the natural bearish W scenario—with equal highs and equal lows reinforcing the first W—would confirm continuation. Traders may use Fibonacci retracement tools on the recent impulse to refine confluence inside the IC-zone and near first structure, but price action around these key levels remains the primary signal in our support resistance framework.
Key Levels and Scenarios
Bullish scenario: A controlled retrace into the IC-level that holds as support, followed by strong bullish candles and a clear neckline break of the inverse H&S; only a daily close above the daily high would confirm a larger trend shift.
Critical levels to watch:
Daily high: Main resistance; trend remains bearish while this level is not closed above.
First structure: Initial support where buyers have already reacted.
IC-level / IC-zone: Core decision area and potential shoulder for the inverse H&S.
Equal highs and lows zone: Confirms the natural bearish W if respected and re-tested.
Daily low region: Deeper downside target if bearish continuation accelerates.
Trading Implications
From a trading perspective, we see asymmetric risk: aggressive longs focus on evidence of bullish reversal at the IC-zone with tight invalidation below, while bears look for exhaustion near the daily high or first structure to position for a renewed leg down toward the daily low, always sizing positions according to predefined risk and volatility.
This content is for educational purposes only and is not financial advice; always do your own research before making any investment or trading decisions.