


This Bitcoin daily analysis for early December 2025 focuses on the battle around the current daily high after a strong bounce from the recent lows. Our technical analysis tracks whether price confirms a new bullish reversal structure or respects the existing bearish context and reverts lower.
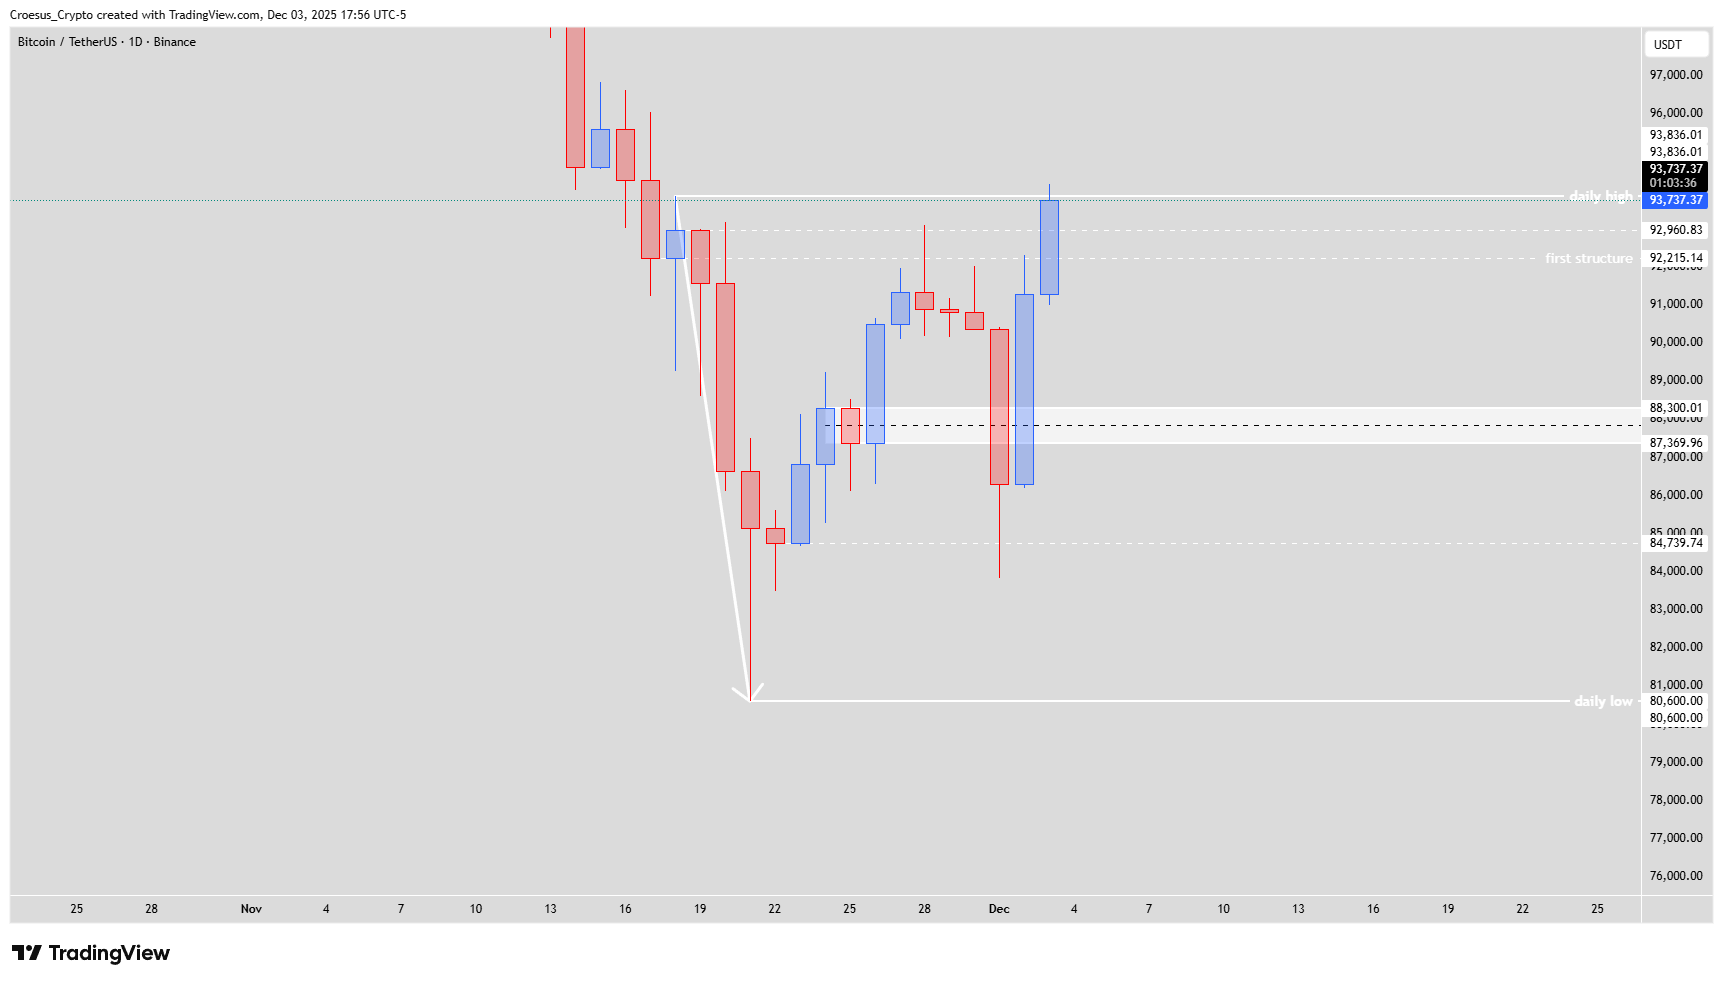
BTCUSDT daily chart 3 Dec 2025 zoom on price testing daily high above prior swing low and IC structure zone
Trend = bearish ↓
Technical Analysis Key Points
- Today the price continued pushing higher, testing the daily high. If we see a candle close above the daily high, we prefer the bullish set-up. If we see a candle close below the daily high, the bullish set-up is possible, but the bearish set-up remains valid.
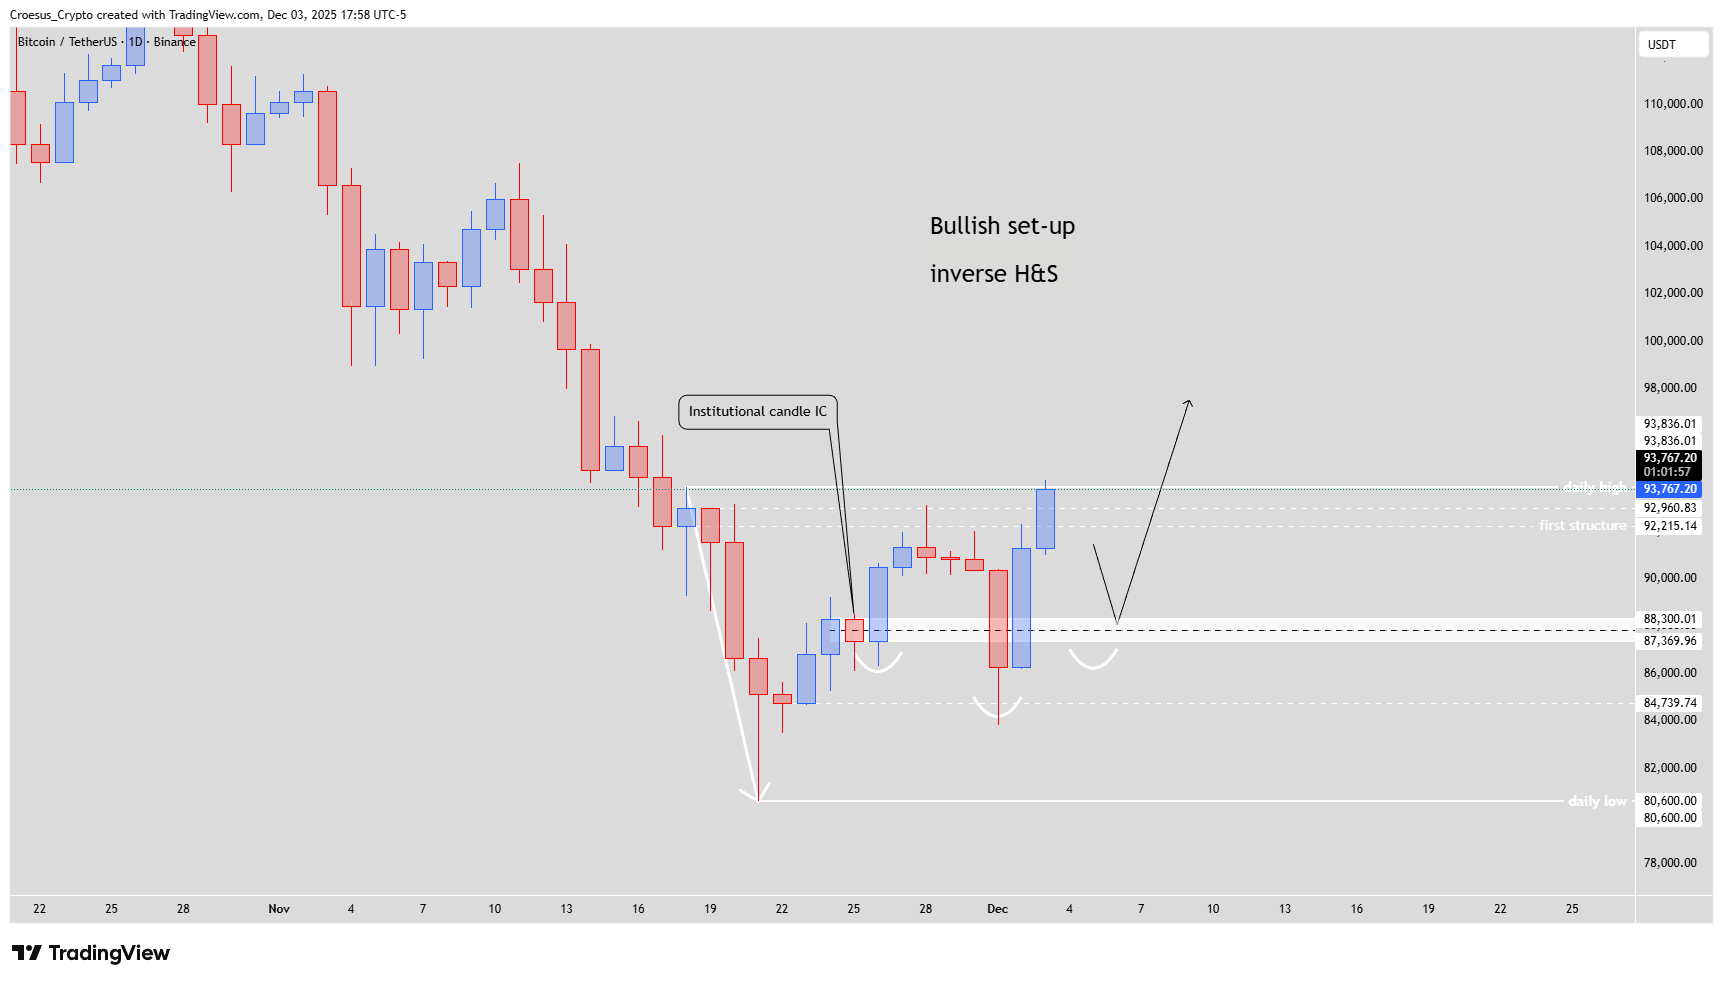
- Bullish set-up : we have a switch of momentum. If price corrects towards the IC-level we could see the formation of a inverse head and shoulders pattern, where the IC-level would act then as the shoulder level. During an eventual retrace we will be watching the price action at this level.
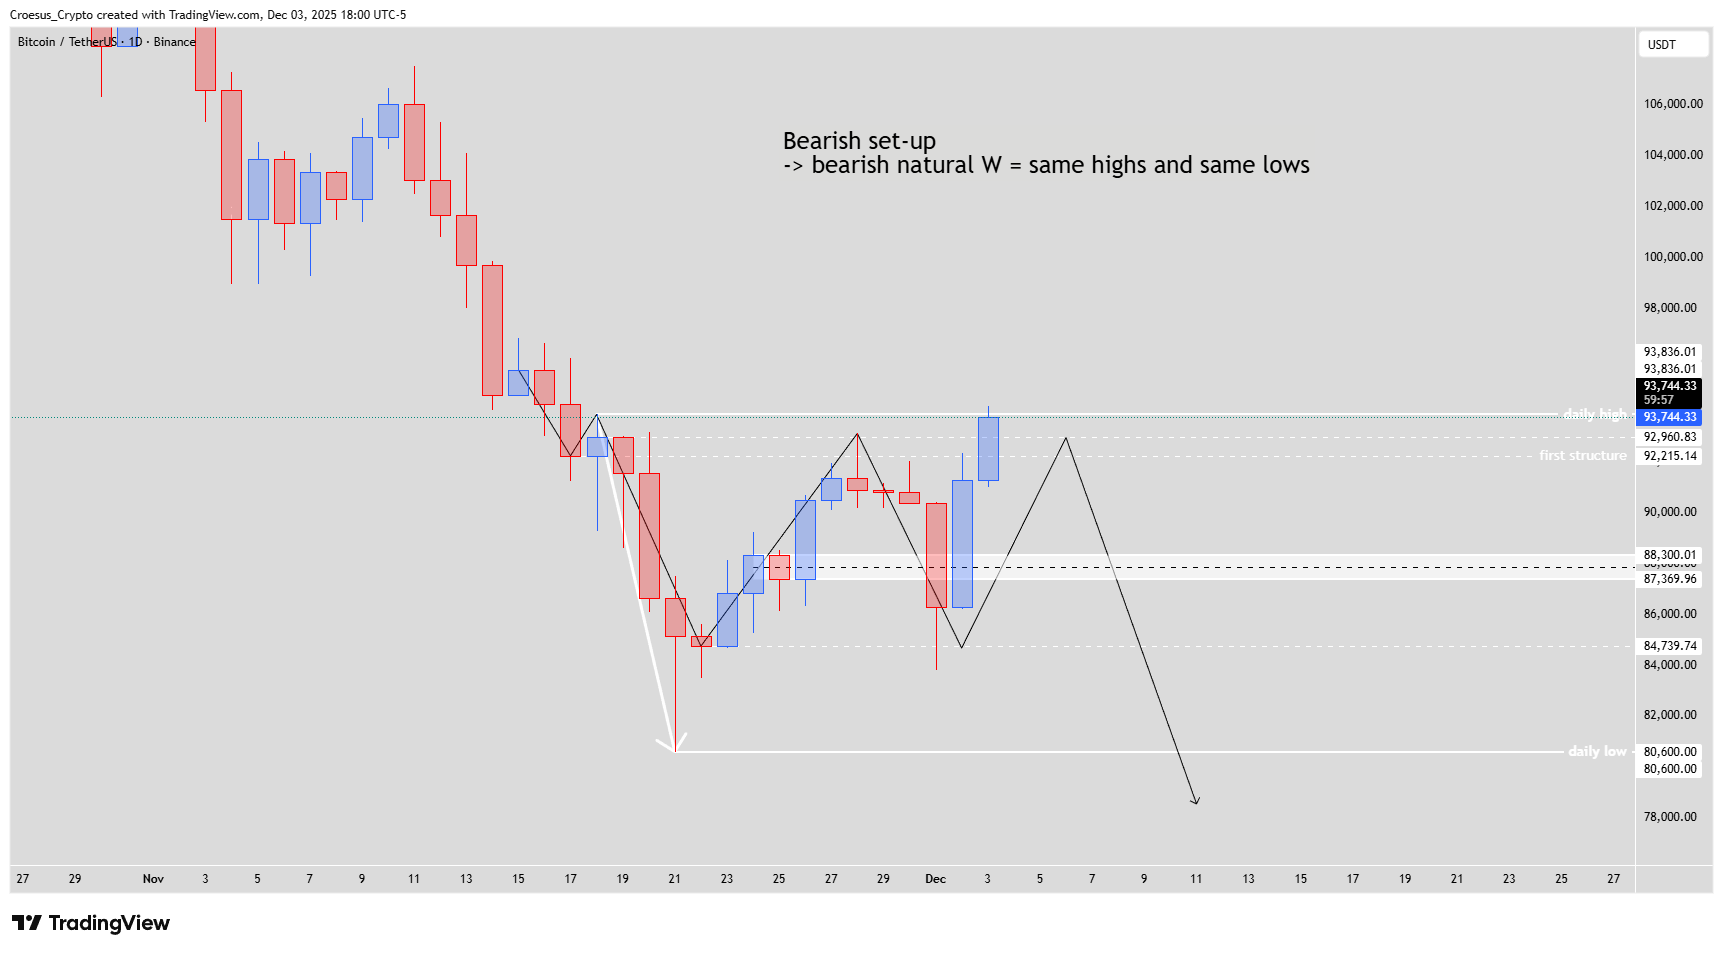
- Bearish set-up : market structure is still predominantly bearish, the daily still isn't broken, not even touched. This means that price possibly prints a natural bearish W. This means that after a bearish W, price prints equal lows and equal highs, confirming the first bearish W.
Market Structure Analysis
Our Bitcoin daily analysis shows price pushing directly into the daily high, a key support resistance flip zone after the prior sell-off. A decisive close above that level would signal a clear momentum shift and leave room for an inverse head and shoulders to develop, with the IC-level acting as a key demand pocket and potential right shoulder.
As long as the daily high is not broken, the broader market structure stays bearish. Equal highs into resistance combined with equal lows would complete a natural bearish W, reinforcing the initial downside impulse. In this reading, any bounce into the daily high is only corrective, and the market could rotate back toward the recent lows once liquidity above local highs is taken. This technical analysis focuses on price action and horizontal levels rather than Fibonacci tools, keeping the structure straightforward.
Key Levels and Scenarios
Bullish scenario: Daily candle closes and holds above the daily high, then a controlled retrace into the IC-level shows buyers defending that zone, allowing the inverse head and shoulders to complete and extend the recovery.
Key areas to watch:
Daily high resistance: break and hold above confirms bullish preference.
IC-level support: potential shoulder zone in the inverse H&S.
Equal highs region: rejection here favors continuation of the bearish W.
Recent equal lows: loss of this area confirms renewed bearish momentum.
Prior swing low zone: last line of defense before a deeper continuation leg
Trading Implications
Traders may want to stay reactive here, waiting for a clear daily close relative to the high and then using the IC-level and equal highs/lows as precise invalidation points, with position size adapted to Bitcoin’s current volatility.
This content is for educational purposes only and is not financial advice; always do your own research before making any investment or trading decisions.