


BTC Marketcap / Bitcoin
BTC daily analysis 04 February 2026. Bitcoin remains structurally bearish while price is pressing into a prior monthly reference, and our BTC daily analysis treats any upside as relief until market structure proves a reversal.
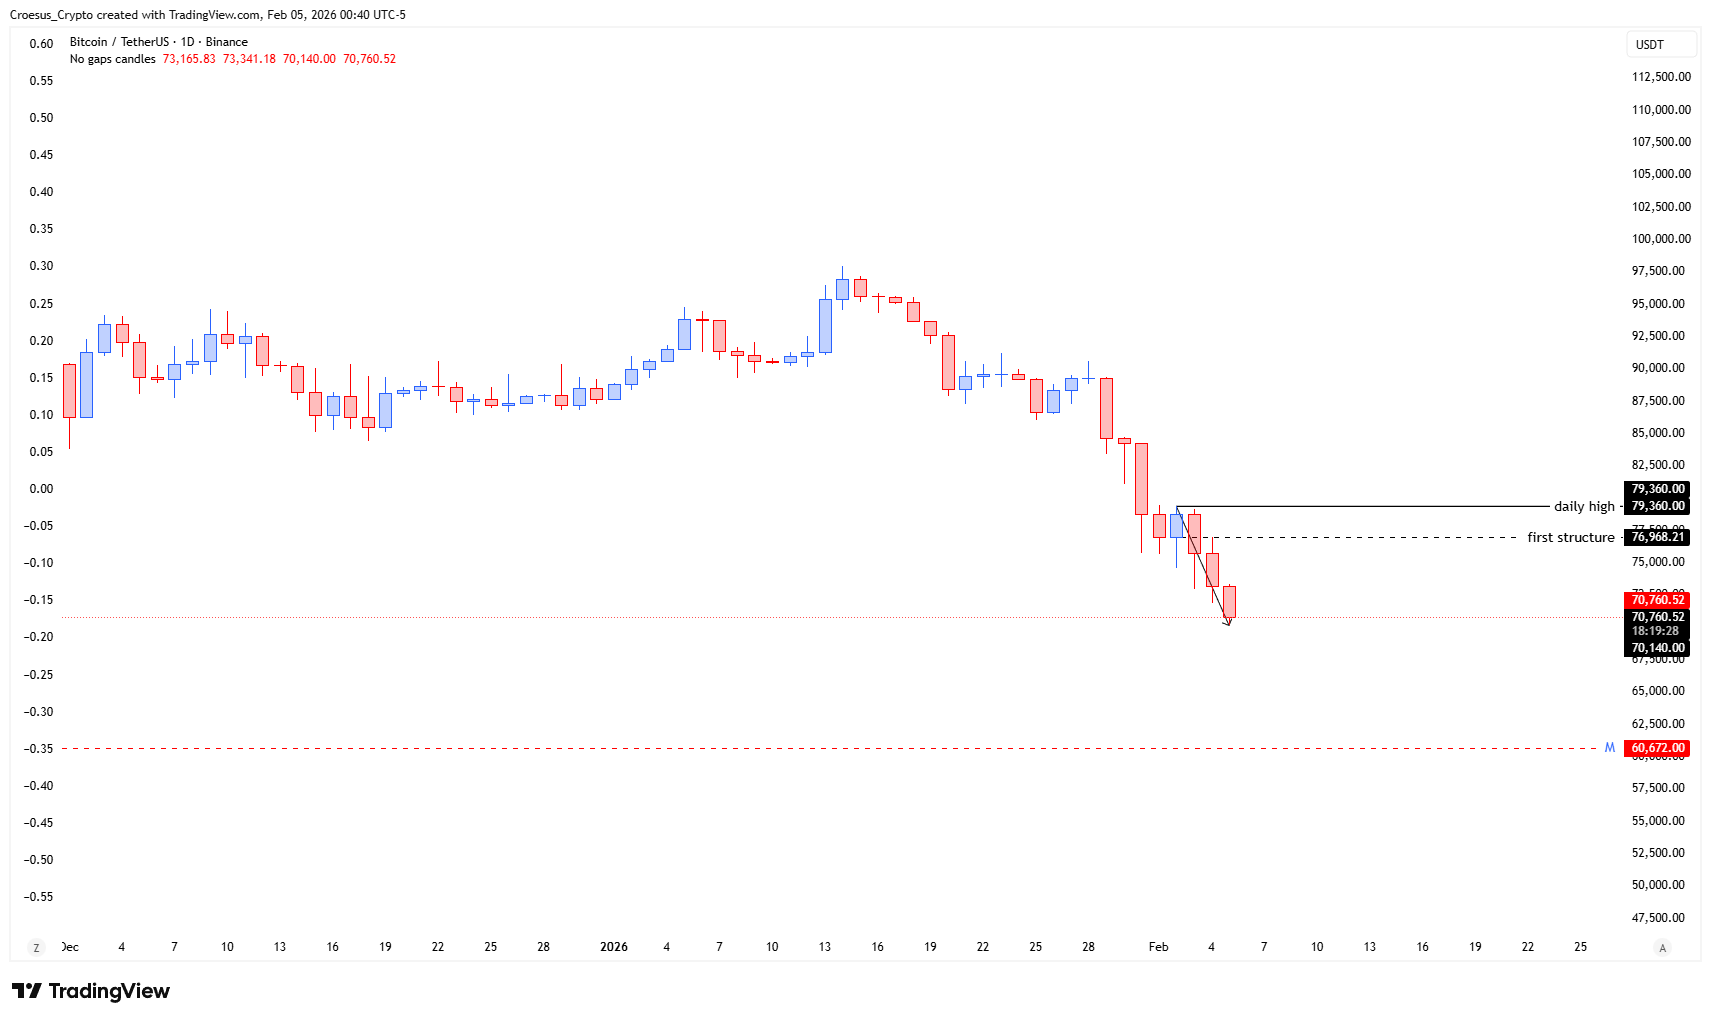
- A slight bullish relief did not even make towards the golden pocket showing a complete lack of power of the bulls
- The price is testing the monthly prior highs at this moment @ $71.280
- But on the lower timeframes even the 4H, we still don't see any signs of reversal.
Market Structure Analysis
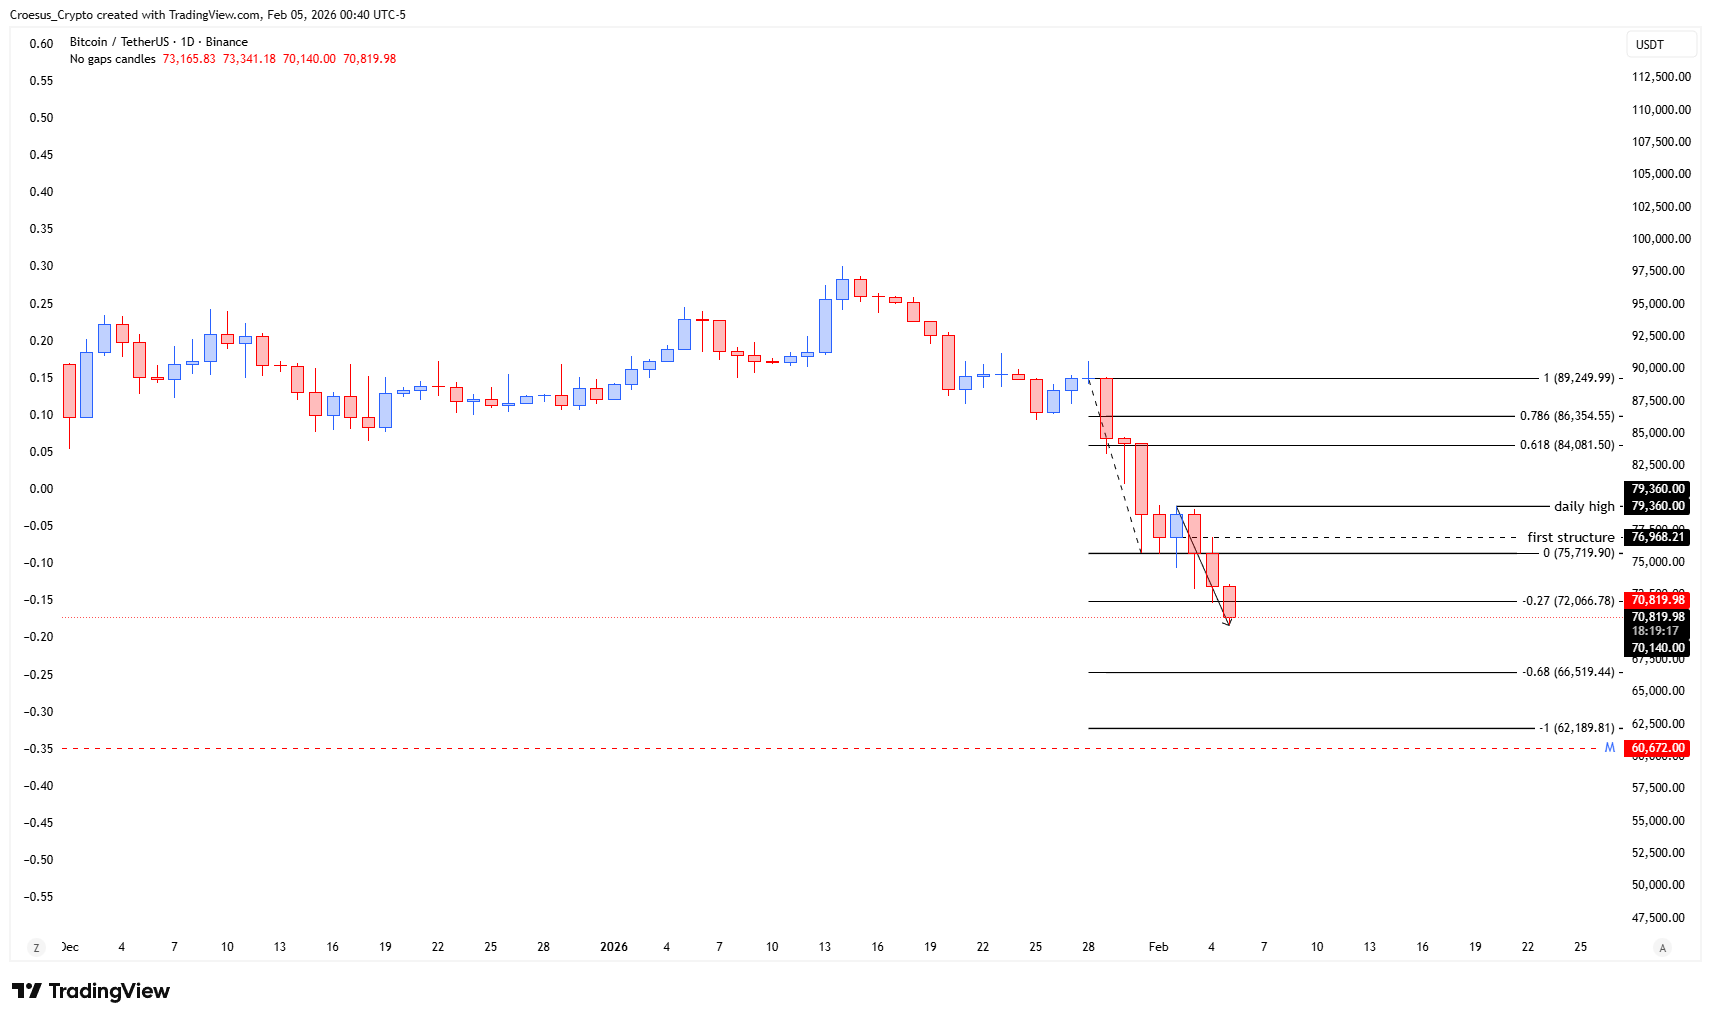
From a naked trading perspective, the trend line liquidity sweep is the key structural event: price runs stops clustered around the trend line and then reacts, often creating the conditions for a corrective bounce. The first bullish candle after a series of bearish candles signals that sellers are losing immediate control, but our BTC daily analysis still treats this as a counter-trend correction until a clean break of structure develops. The Fibonacci retracement context matters because the 0.786 confluence with the “first structure” frames a logical relief zone where price can retest prior supply before resuming the bearish impulse. Importantly, the recent bearish leg landing near $74.604,00 while leaving the $74.508,00 3 monthly swing low untouched keeps downside liquidity active and structurally relevant, reinforcing the current support resistance map.
Key Levels and Scenarios
In this BTC daily analysis, the bearish baseline remains intact unless price starts reclaiming key structure with acceptance. The bullish relief scenario is a corrective push into the first structure / Fibonacci 0.786 confluence, followed by rejection behavior. The bearish continuation scenario is a relief failing under structure and price rotating back down to take the remaining liquidity at the 3 monthly swing low.
- Fibonacci 0.786 confluence with the first structure as the potential relief target zone
- $74.604,00 as the recent bearish impulse landing point and near-term reference level
- $74.508,00 3 monthly swing low as the key liquidity level still expected to be taken
- Trend line liquidity sweep area as the prior stop-run zone to monitor for retests
- $71.280 as the monthly prior highs currently being tested
Trading Implications
With the trend still bearish, upside price action is treated as corrective unless BTC prints a clear break of structure and holds it on retest. Aggressive participants typically focus on short-lived relief and rejection at Fibonacci confluence, while conservative participants wait for cleaner confirmation around support resistance and follow-through toward the liquidity objective.
This analysis is for informational purposes only and does not constitute financial advice.