


BTC Marketcap / Bitcoin
BTC monthly analysis 05 February 2026. Bitcoin remains under bearish pressure as sellers keep pushing price lower, while our technical analysis focuses on whether the market can stabilize at a major higher-timeframe structure level.
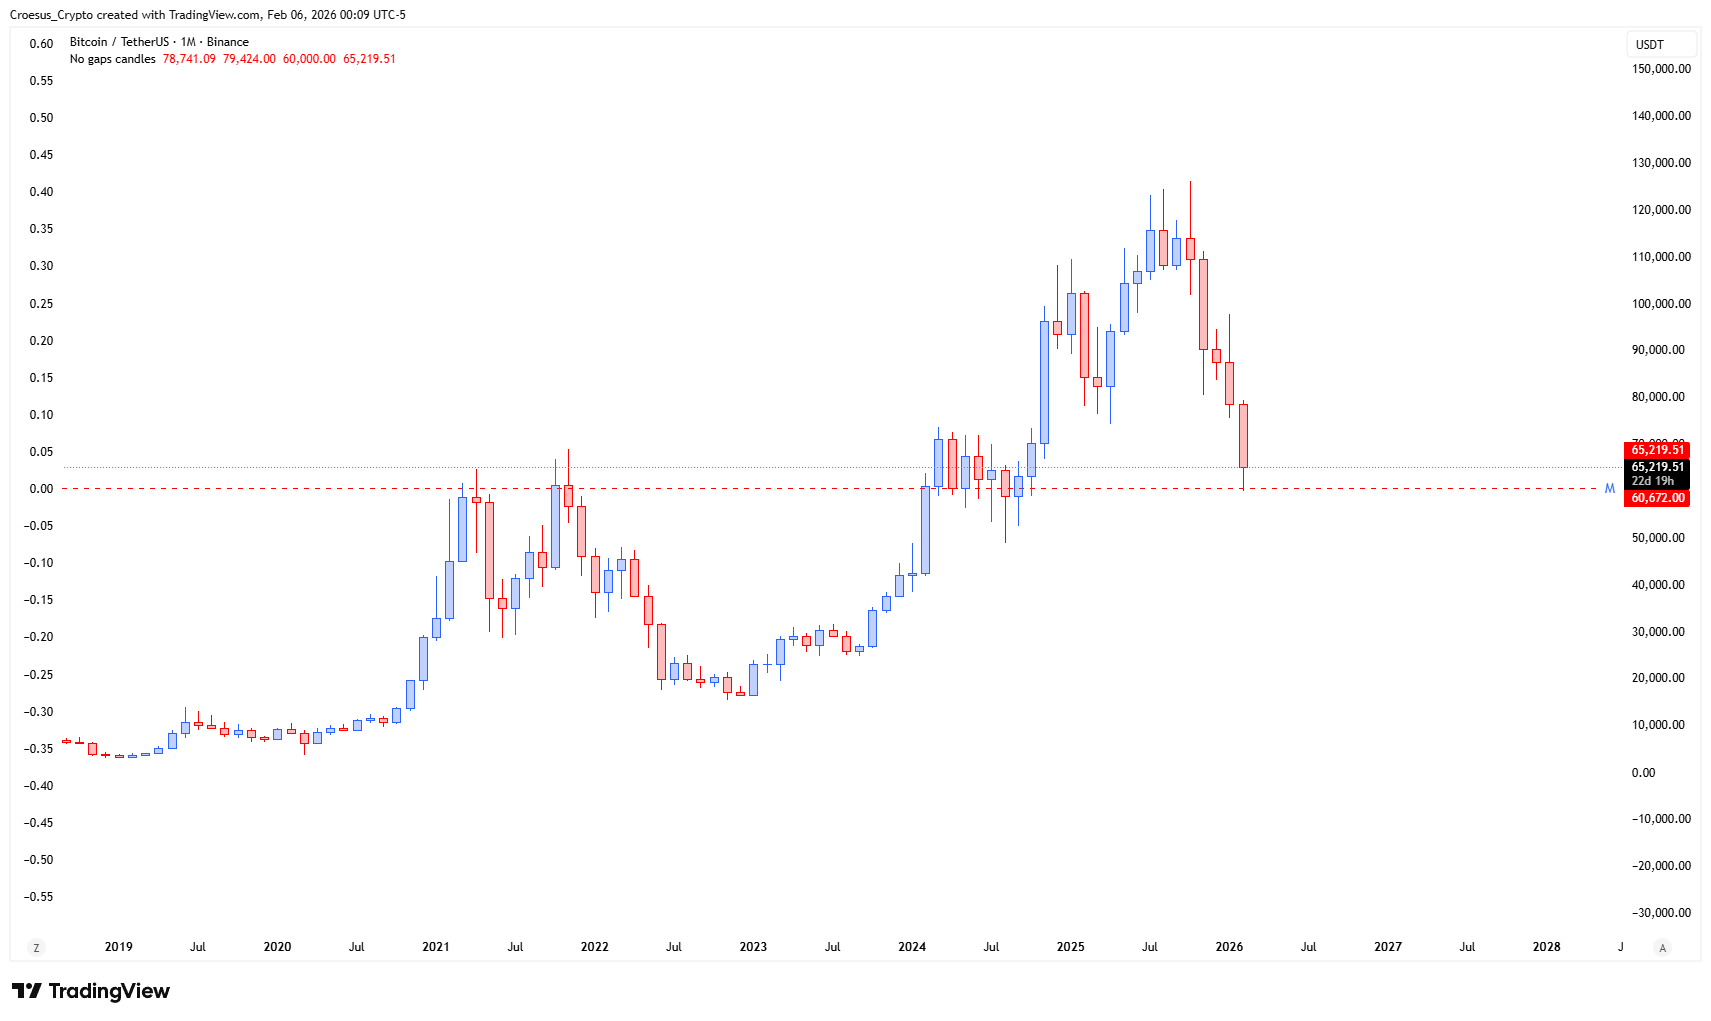
- Bears are pushing further down
- If we zoom out the price has hit a monthly key shoulder level, that acted as resistance at the highs of the prior bullrun
- Eventhough this level could act as support, we would need to see some clear reversal at this moment and bulls need to show their will for reversal.
Market Structure Analysis
The dominant structure in this BTC monthly analysis is the ongoing bearish drive into a major monthly “shoulder level” that previously capped price during the prior bullrun highs. Structurally, this is a critical support resistance zone: a former resistance area often becomes a decision point when revisited, but it is not automatically support unless buyers prove it through a clear reversal response. As long as bears continue to push further down, the market is treating this zone as a waypoint rather than a floor. For any meaningful shift in market structure, we want to see evidence that selling pressure is absorbed and that bulls can reclaim and defend the level with conviction, otherwise the downside pressure remains in control.
Key Levels and Scenarios
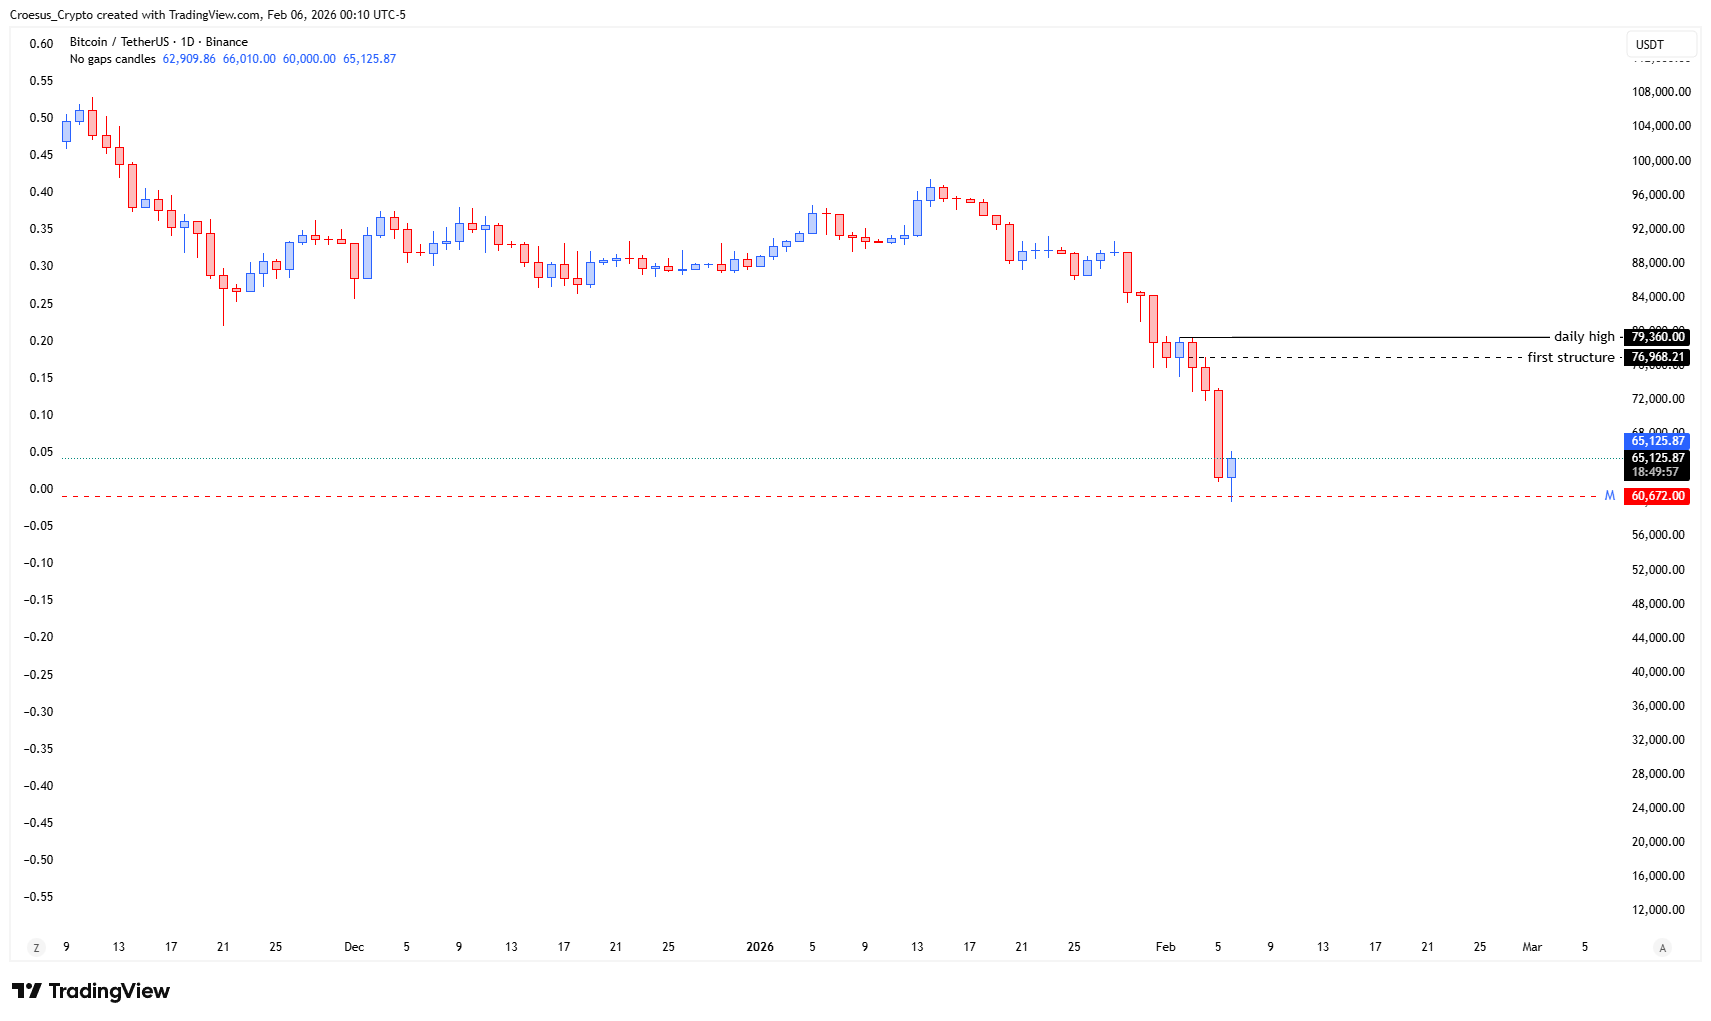
In the bearish scenario, continuation remains favored while price stays weak and fails to print a clear reversal from the monthly shoulder area. In the bullish stabilization scenario, BTC needs an obvious reversal reaction off this monthly level, signaling that the prior resistance is now being defended as support and that sellers are losing control.
- Monthly key shoulder level (current decision zone; must hold to build a base)
- Prior bullrun highs resistance area (context for why this zone is technically important)
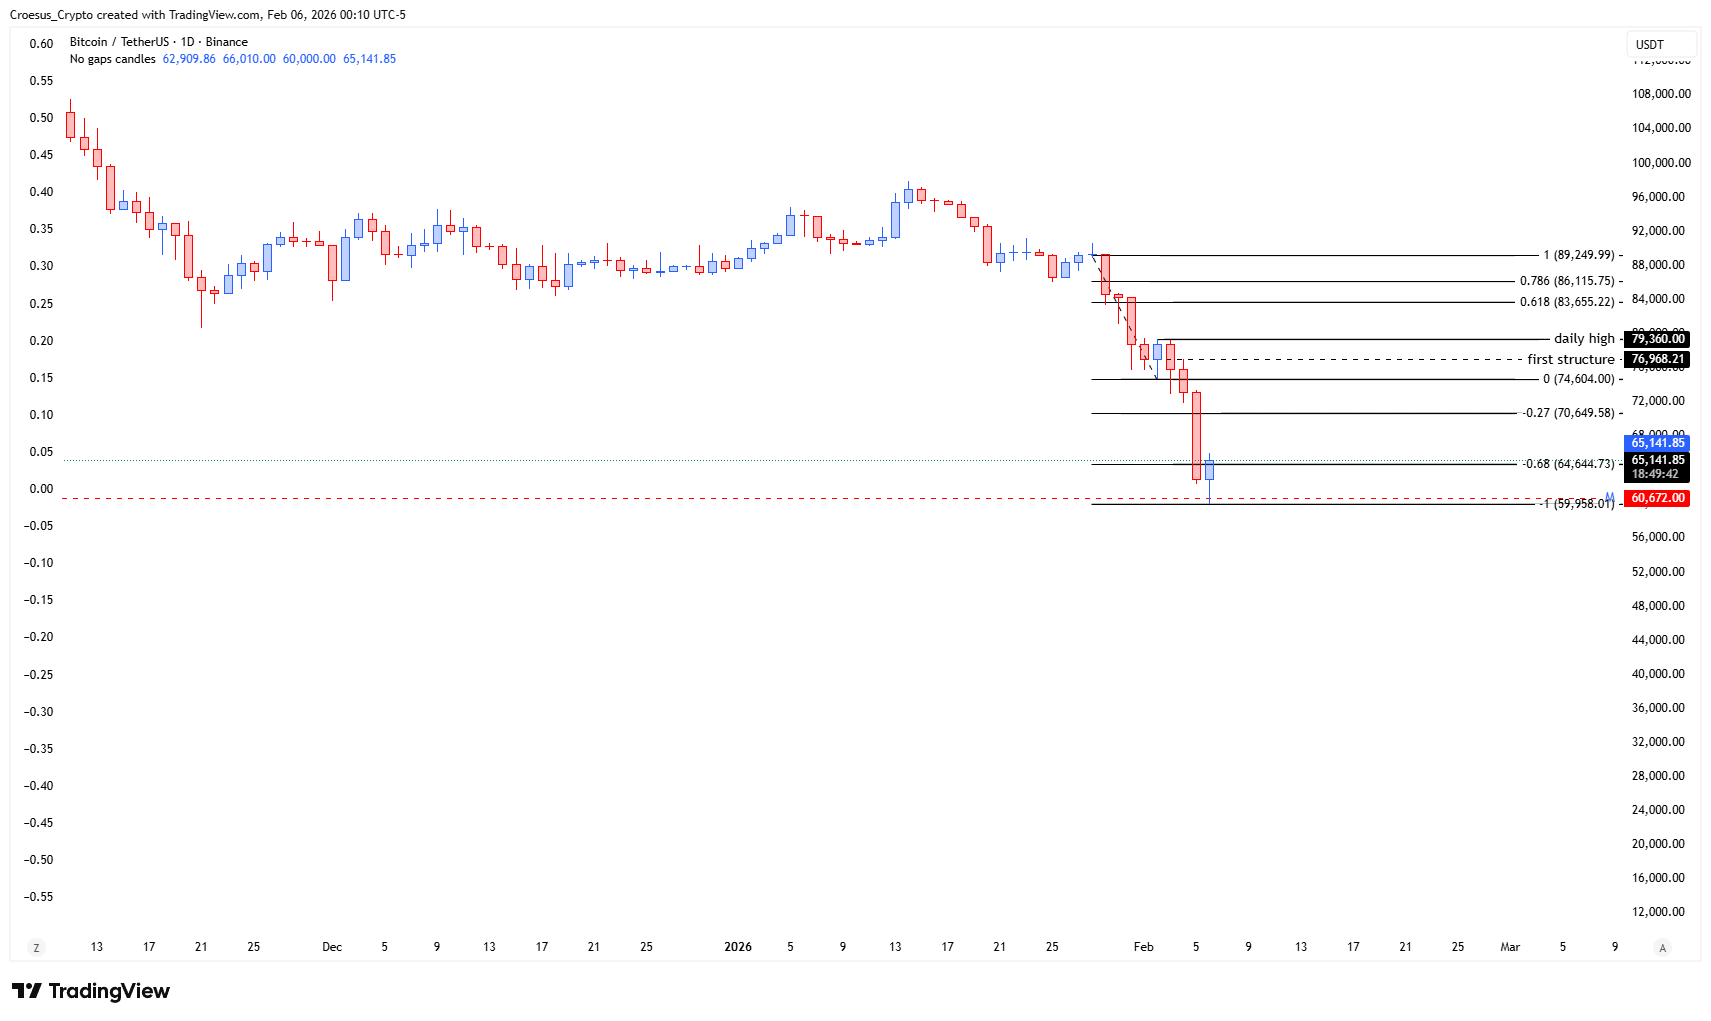
- Reversal confirmation area (needs a clear shift in price behavior before bias can improve)
Trading Implications
From a risk perspective, this is a high-impact higher-timeframe zone: aggressive participants typically look for early reversal evidence at support, while conservative traders often wait for clearer confirmation that the market has actually shifted away from bearish continuation. Until that reversal is visible, our BTC monthly analysis remains defensive around this support resistance area.
This analysis is for informational purposes only and does not constitute financial advice.