BTC Marketcap / Bitcoin
BTC daily analysis 05/03/2026. Bitcoin is pausing after an energy-heavy breakout, and our BTC daily analysis focuses on whether this move resolves as a clean corrective retest or expands into a deeper pullback while the broader trend remains bearish.

- After the break-out, which took a lot of energy to break out of a consolidation area of 25 days, we see a pause, a corrective move, possibly to retest the neckline.
- The inverse head and shoulders pattern is still playing out at this moment.
Market Structure Analysis
Structurally, the market transitioned from a 25-day consolidation into an impulsive breakout, followed by a pause that reads as a corrective structure rather than immediate continuation. In a bearish backdrop, this type of post-breakout correction often acts as a “decision zone” where prior resistance can flip into support on the retest. The mention of a possible neckline retest keeps the inverse head and shoulders framework relevant: price is effectively testing whether the breakout has enough follow-through to hold reclaimed structure, or whether sellers can force acceptance back into the prior range.
From a naked trading perspective, the key is the reaction at the neckline area—strong rejection wicks and failure to reclaim would keep downside pressure dominant, while clean holds and higher lows would support the pattern continuing to develop.
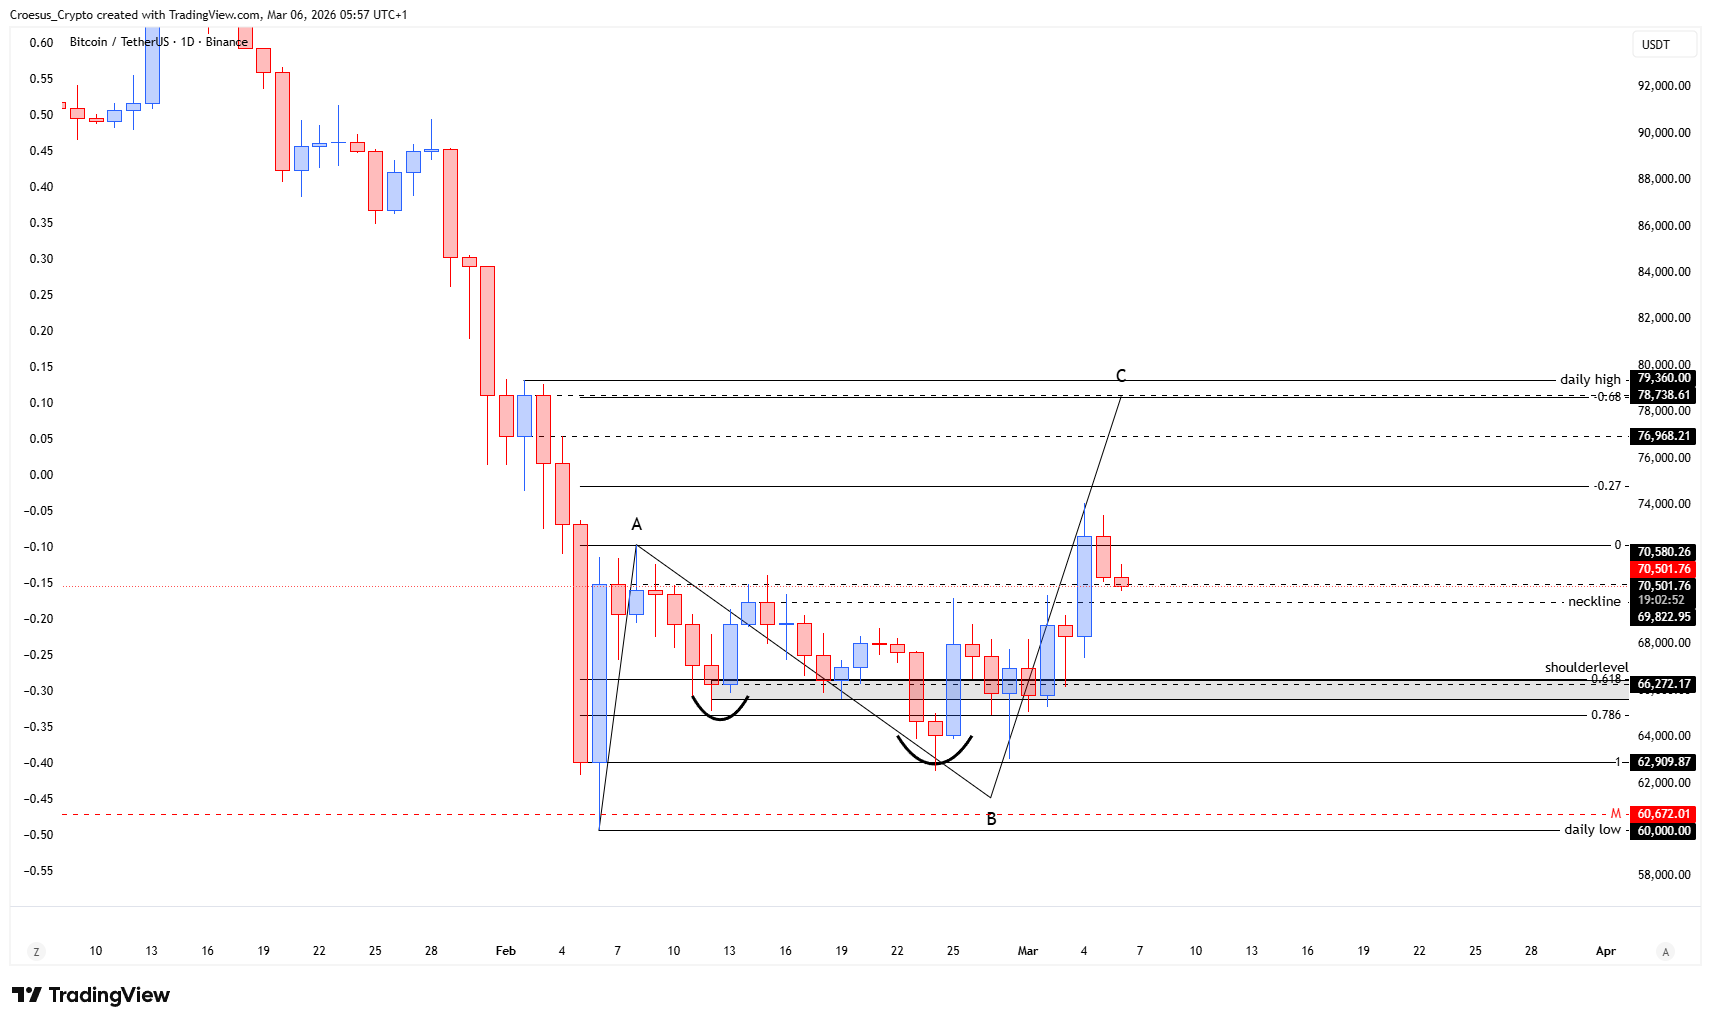
Key Levels and Scenarios
In this BTC daily analysis, the primary bearish risk is that the current pause resolves into a deeper correction that gives back the breakout. The more constructive scenario is a controlled pullback that respects the neckline and keeps the inverse head and shoulders active.
- Breakout level from the 25-day consolidation area (key acceptance/rejection zone)
- Neckline area (primary retest level referenced by the current corrective move)
- Consolidation range boundaries (context for whether price is returning into the prior range)
Trading Implications
For execution, the chart is in a “confirmation required” area: aggressive traders typically focus on the immediate neckline reaction, while conservative traders generally wait for the corrective move to complete and structure to confirm. Risk stays elevated if price churns around the neckline with no clean directional follow-through.
This analysis is for informational purposes only and does not constitute financial advice.