


In this BTC daily analysis we focus on today’s muted reaction to the institutional candle (IC) level and what it implies for the next swing. Our technical analysis zooms in on the 4H structure, where the market is deciding between a constructive inverse head and shoulders or a continuation via a natural bearish W.
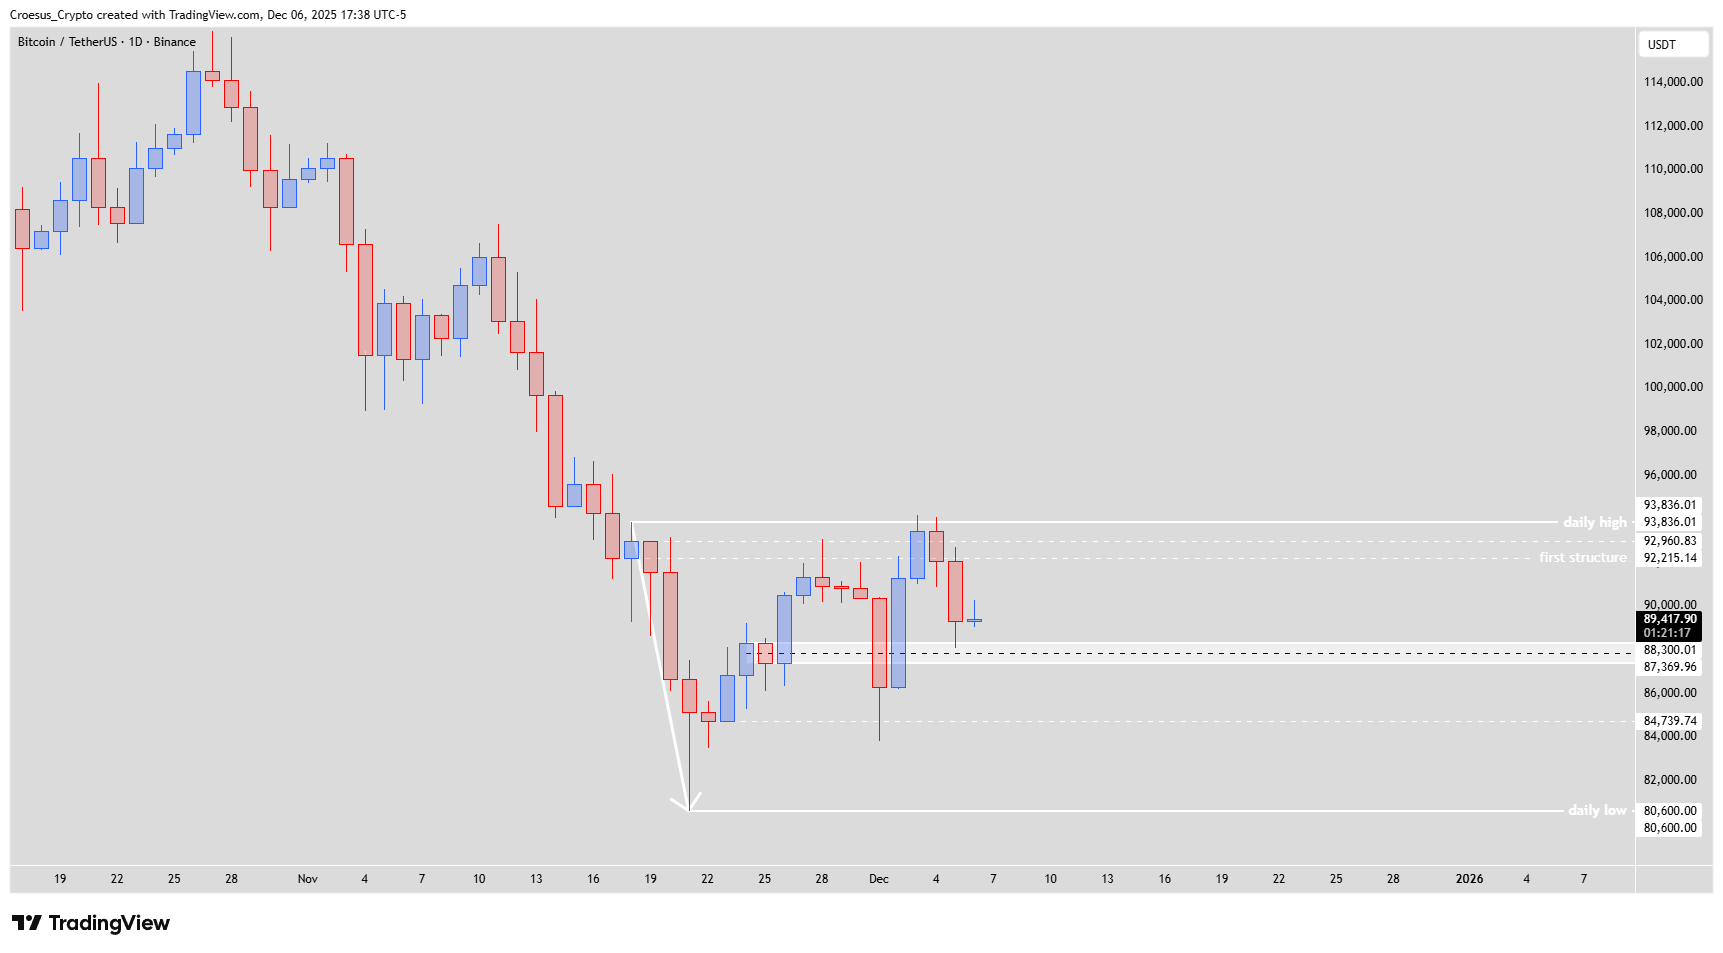
Bitcoin daily chart 06 december 2025 showing IC-level support, daily high and daily low support resistance zones
Trend = bearish ↓
Technical Analysis Key Points
- Where yesterday the price hit the IC zone, today we saw only a shallow bullish reaction.
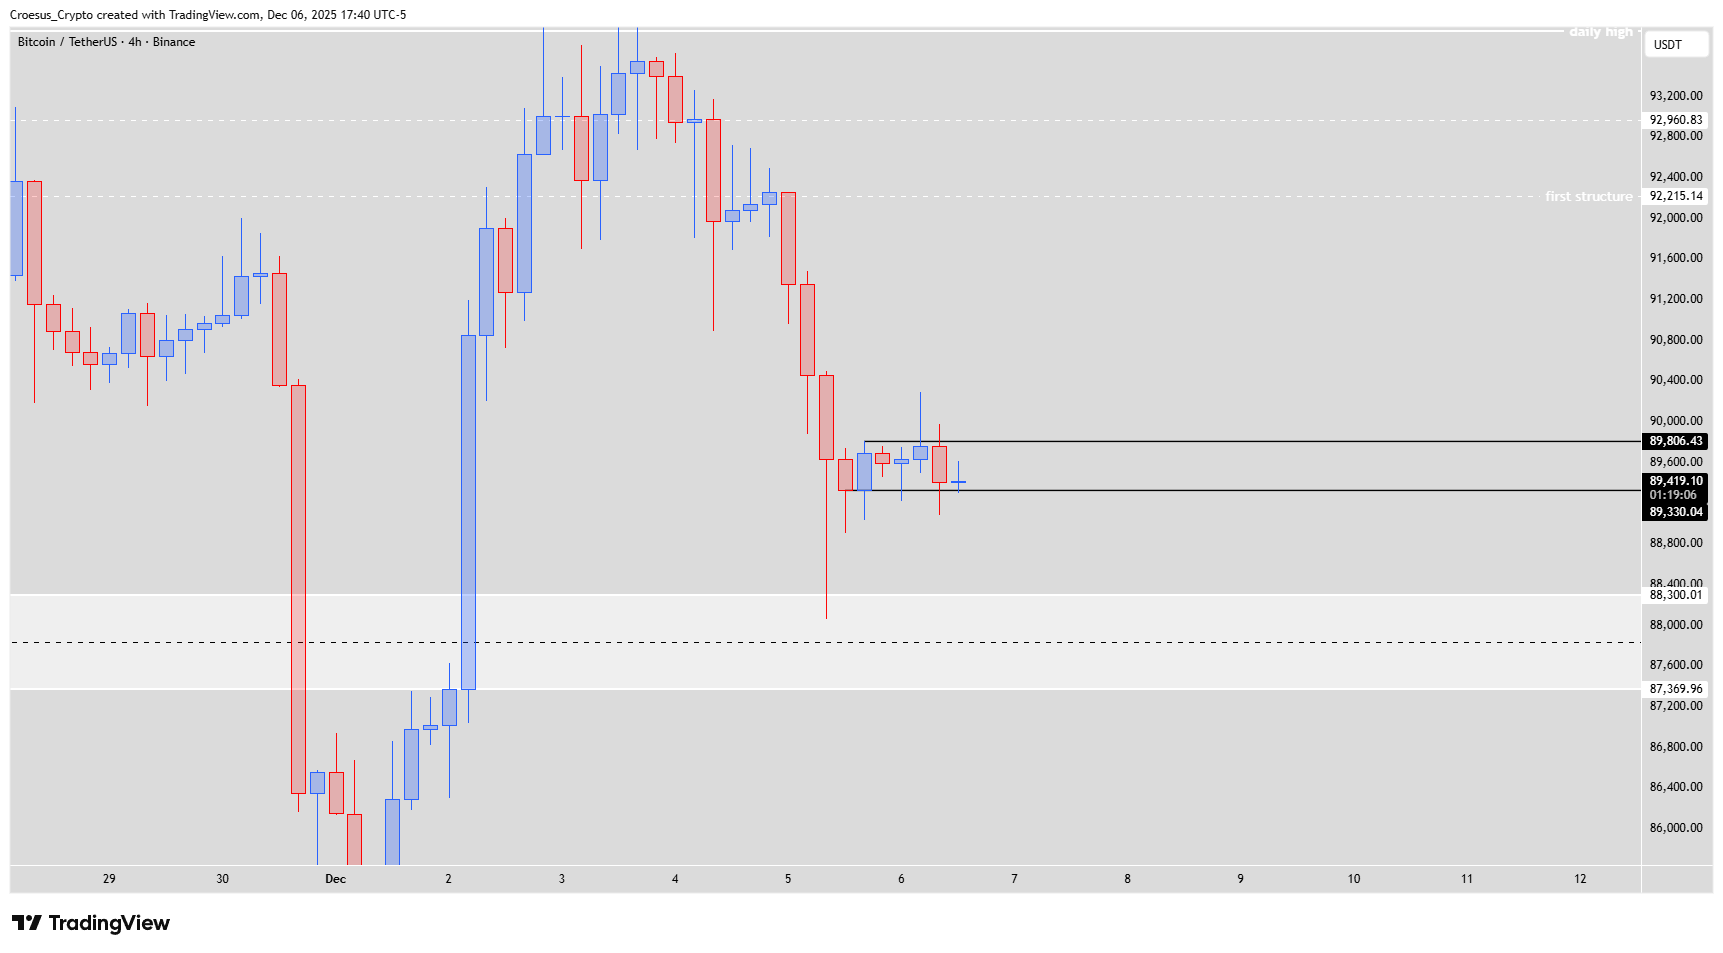
- On the 4H chart the price made a first attempt higher, followed by a retest, but the next attempt higher failed to print a fractal higher high (internal structure). This shows us that bulls are not present yet, at least not with conviction
- We will need to see an impulsive bullish push up on the 4H chart, in order to see some bullish reversal.
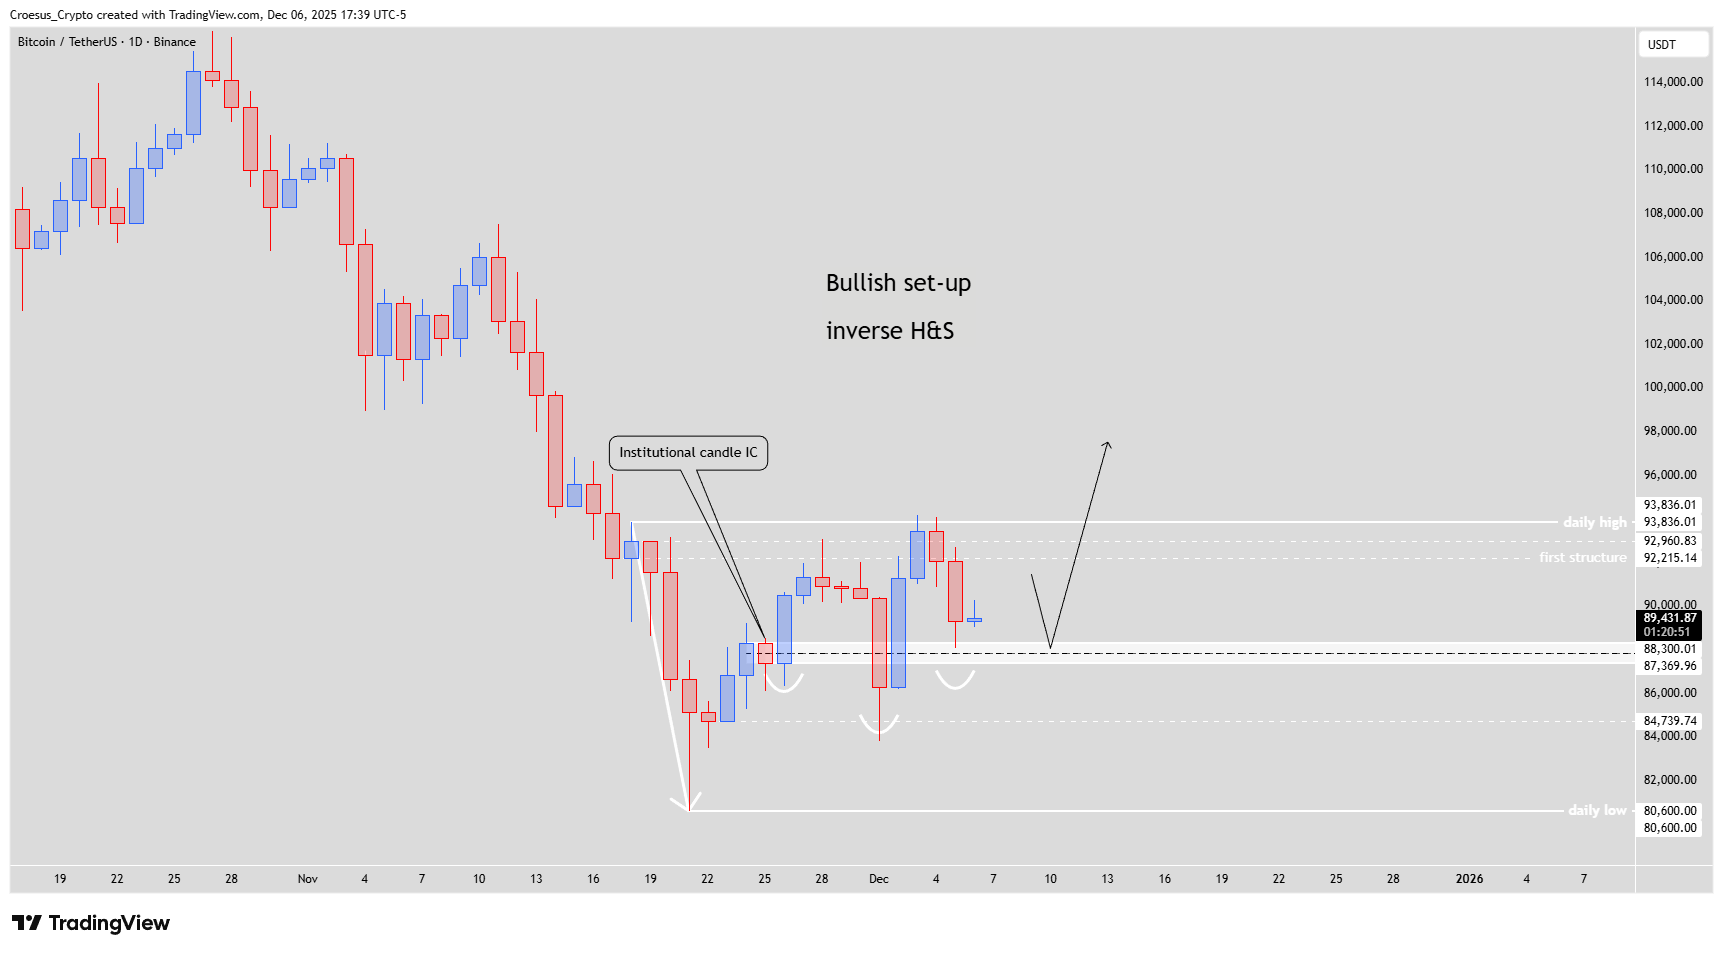
- Bullish set-up : we have a switch of momentum. If price corrects towards the IC-level we could see the formation of a inverse head and shoulders pattern, where the IC-level would act then as the shoulder level. During an eventual retrace we will be watching the price action at this level.
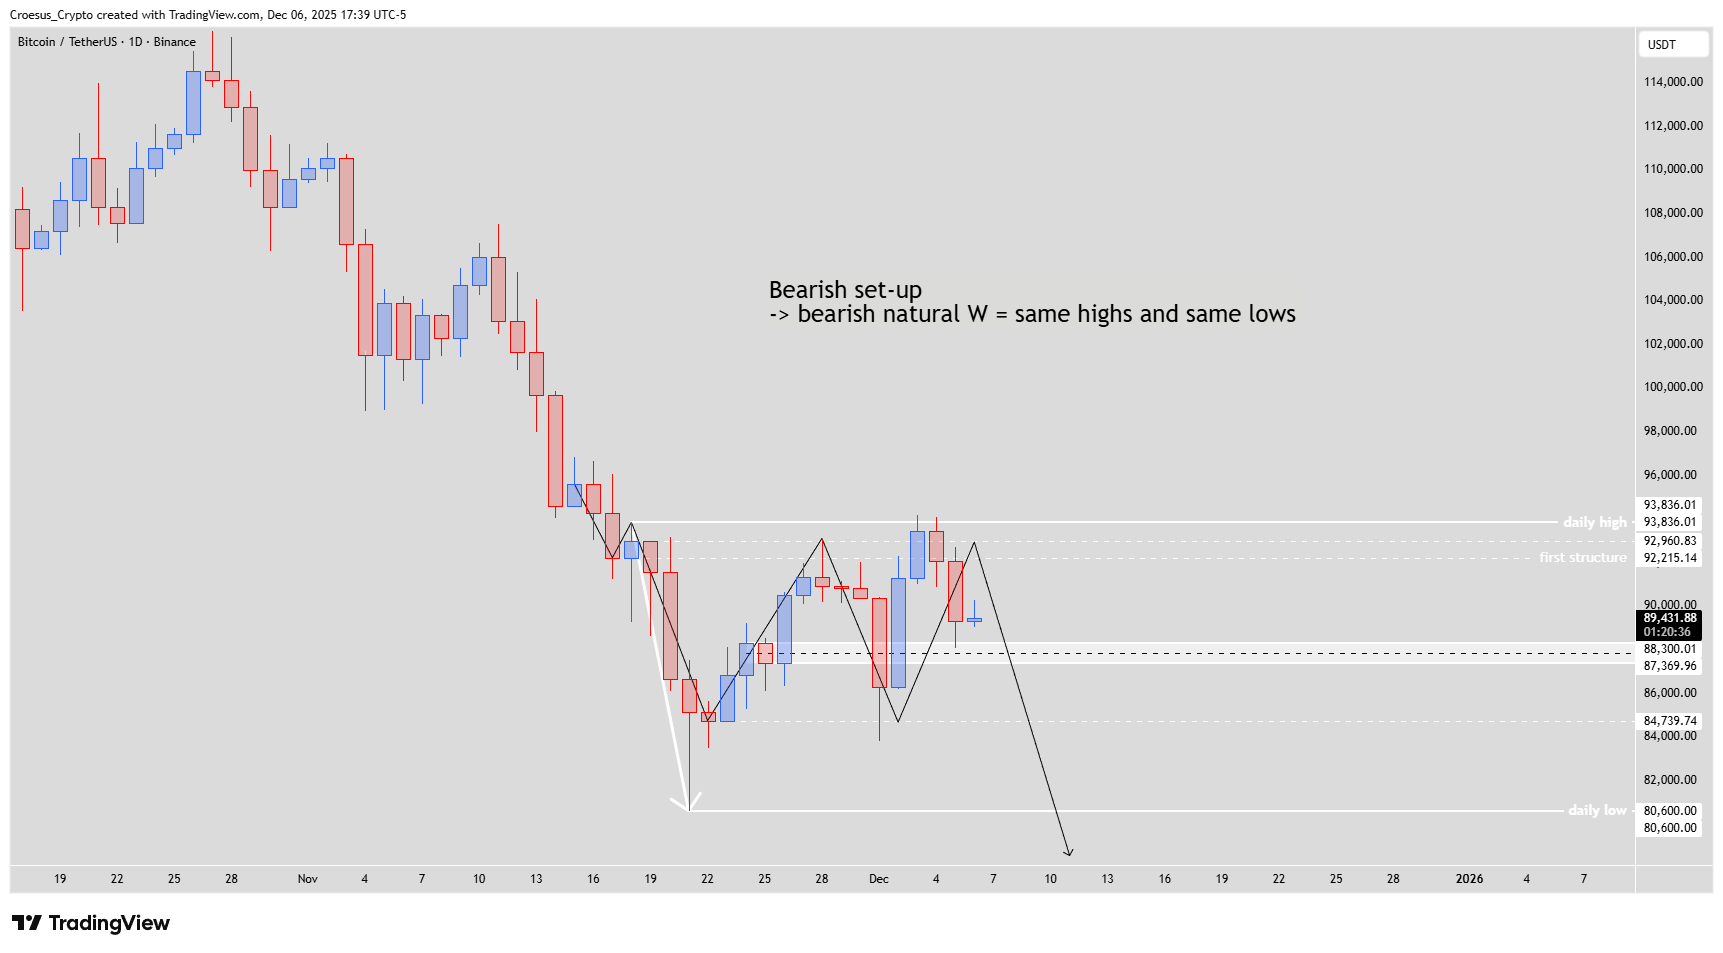
- Bearish set-up : market structure is still predominantly bearish, the daily still isn't broken, not even touched. This means that price possibly prints a natural bearish W. This means that after a bearish W, price prints equal lows and equal highs, confirming the first bearish W.
Market Structure Analysis
Our BTC daily analysis shows that the first touch of the IC-level only produced a shallow bounce. On the 4H chart, the failed attempt to create a fractal higher high keeps internal market structure bearish and tells us that buyers lack conviction. As long as price trades below the nearby daily high and first structure zone, the broader downtrend remains intact and the IC-level acts as the main support resistance pivot.
If the market delivers a clean impulsive push higher from current prices, that would be the first real signal of a momentum shift. A controlled retrace back into the IC-level after that push could then carve out the right shoulder of an inverse head and shoulders, turning this area into a constructive base. Traders can complement this technical analysis with their own Fibonacci tools, but the key decision remains at the IC support.
Key Levels and Scenarios
Bullish scenario:
Momentum flips on the 4H, price drives away from the IC-level and later retests it as support while forming an inverse H&S. A break and hold above the first structure and daily high would confirm a larger trend reversal.
Bearish scenario:
Price fails to reclaim those resistance zones and instead ranges to form equal highs and equal lows after the existing bearish W. That natural bearish W would confirm continuation and open the door to a deeper move toward the daily low region.
Critical levels to watch
IC-level: Primary intraday support; potential shoulder area for inverse H&S.
First structure zone: Key resistance; reclaiming it is required for any sustained trend change.
Daily high: Major upside trigger; break and hold would weaken the bearish setup.
Daily low area: Next downside liquidity pool if the natural bearish W plays out.
Trading Implications
For now, we see an asymmetric setup: conservative traders may wait for either a strong 4H impulsive reversal from the IC-level with tight stops below it, or a clear rejection from first structure/daily high to position for continuation lower, always sizing positions relative to BTC volatility and predefined risk.
This content is for educational purposes only and is not financial advice; always do your own research before making any investment or trading decisions.