


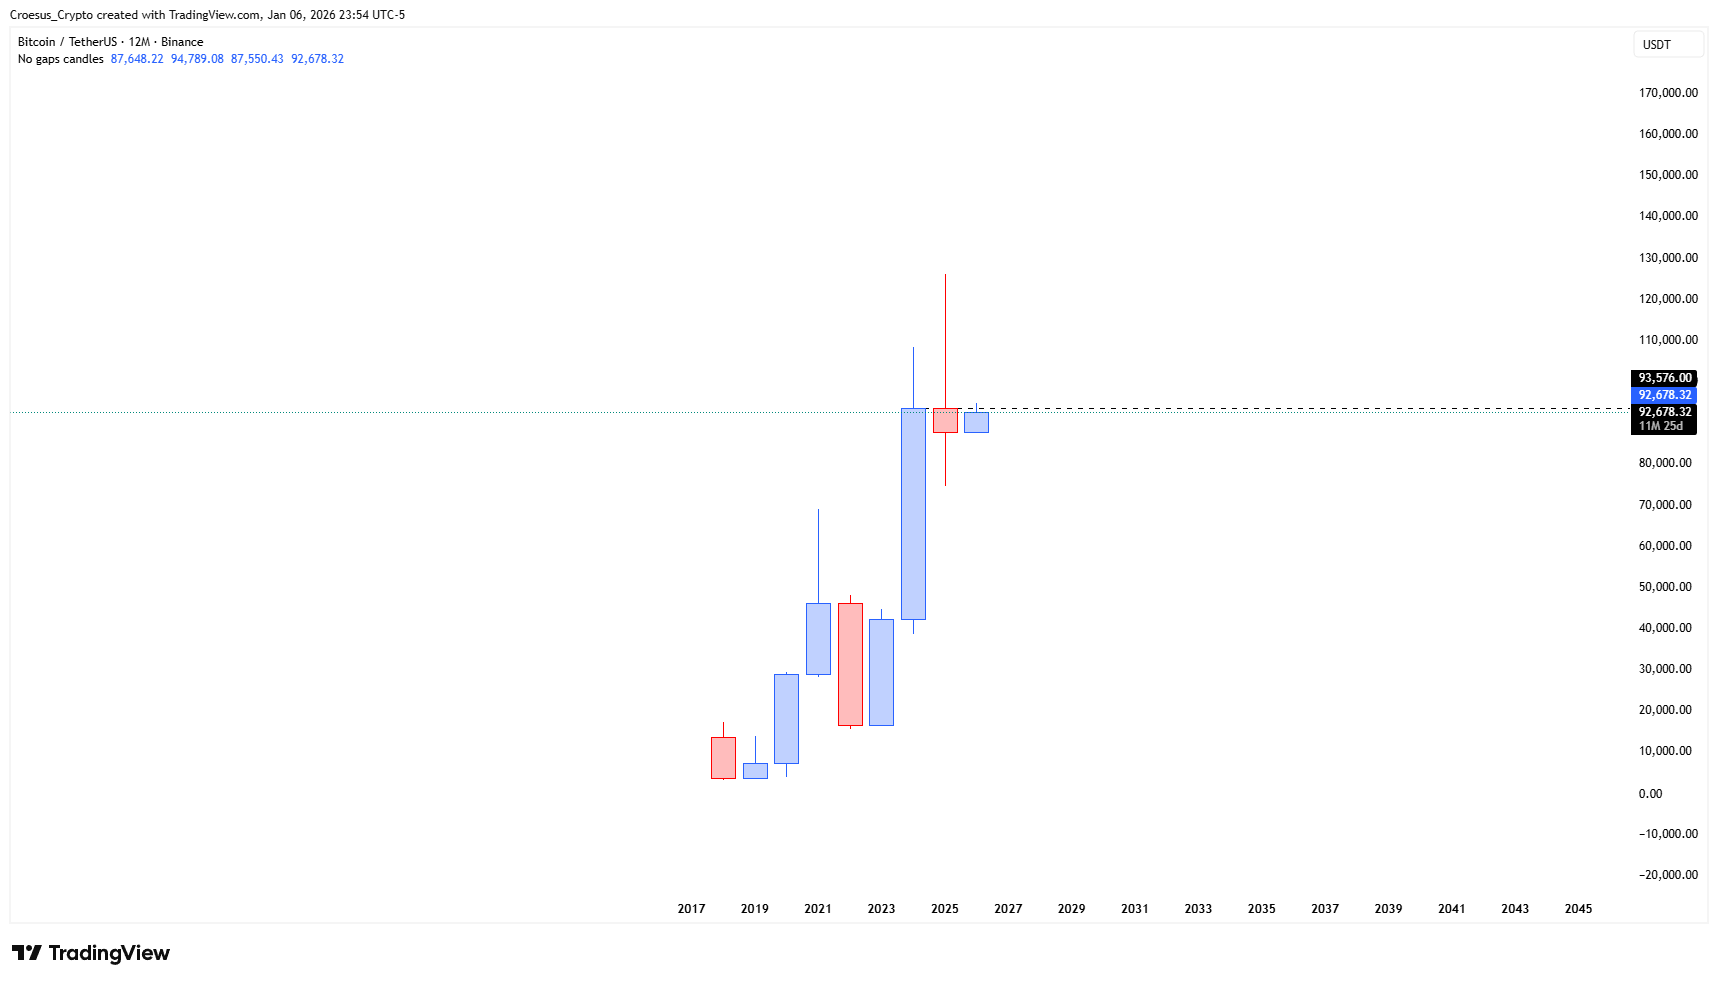
This BTC daily analysis starts from the yearly timeframe. After the yearly close, Bitcoin quickly rallied back to the 2025 opening price, effectively covering the whole 2025 range with one strong bullish weekly move. Price is now pressing into a major weekly level defined by prior lows (blue line), creating a cluster of resistance between the yearly open and that weekly structure.
Bitcoin yearly chart 06 January 2026 with price returning to the 2025 open and key resistance band.
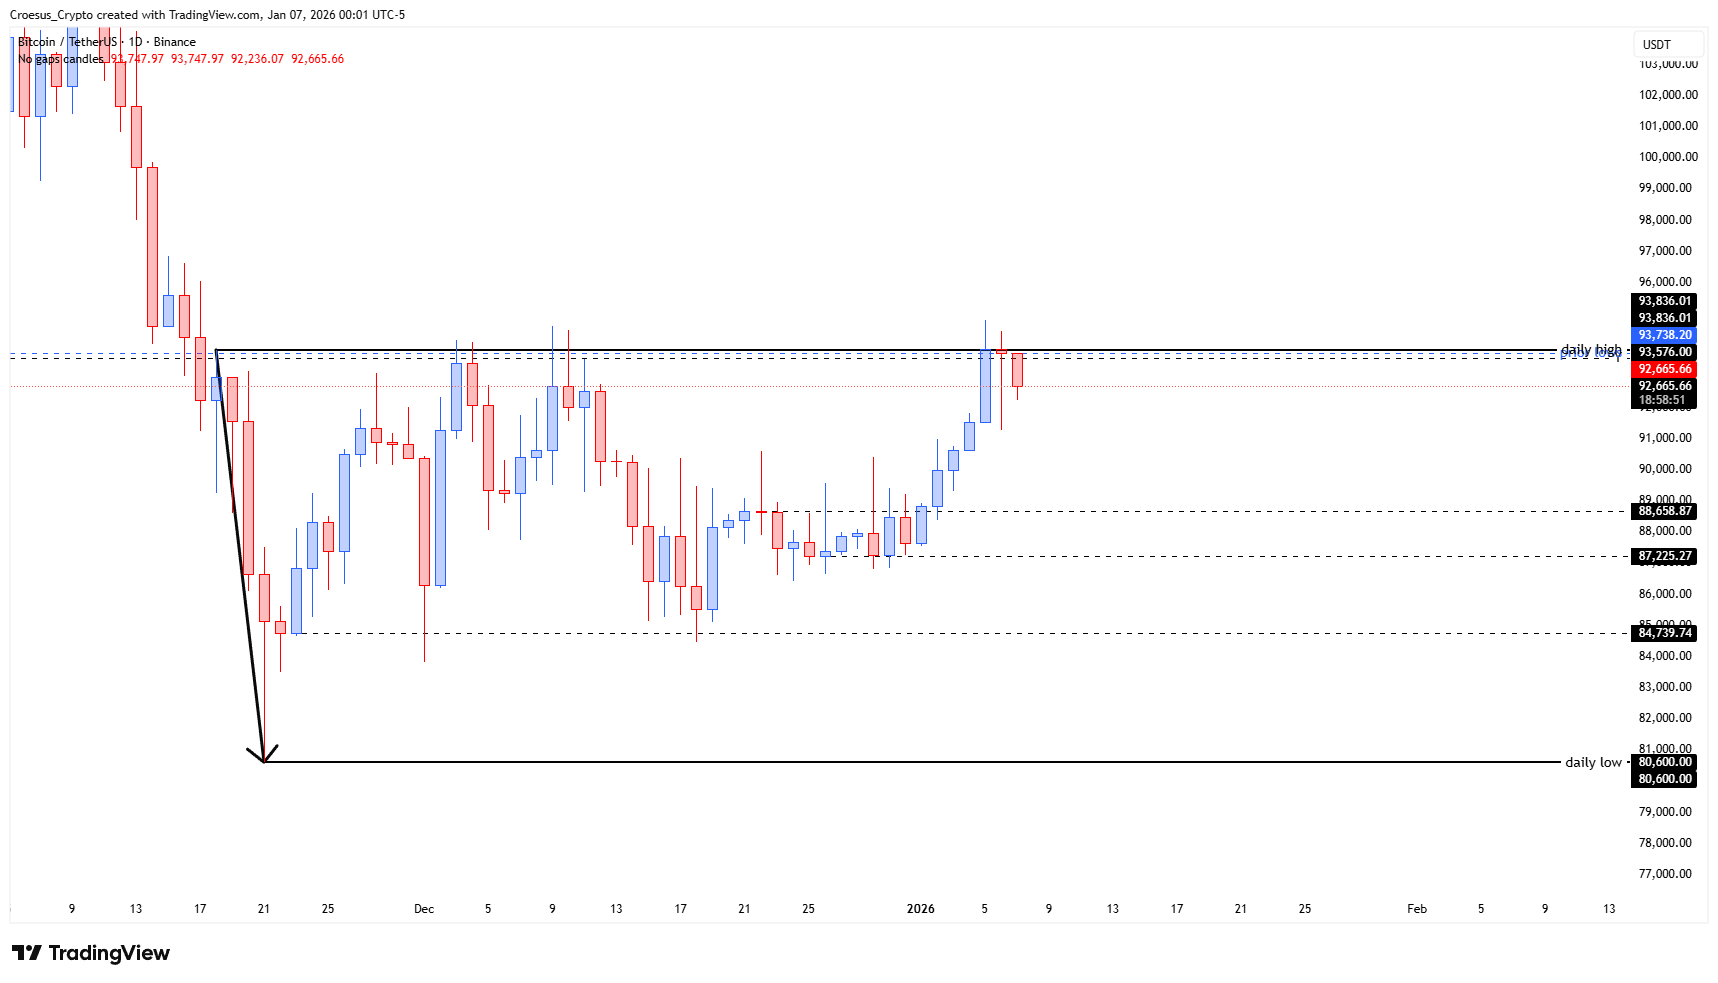
Bitcoin daily chart 06 January 2026 showing recent rally stalling at the prior daily high and long-term range top.
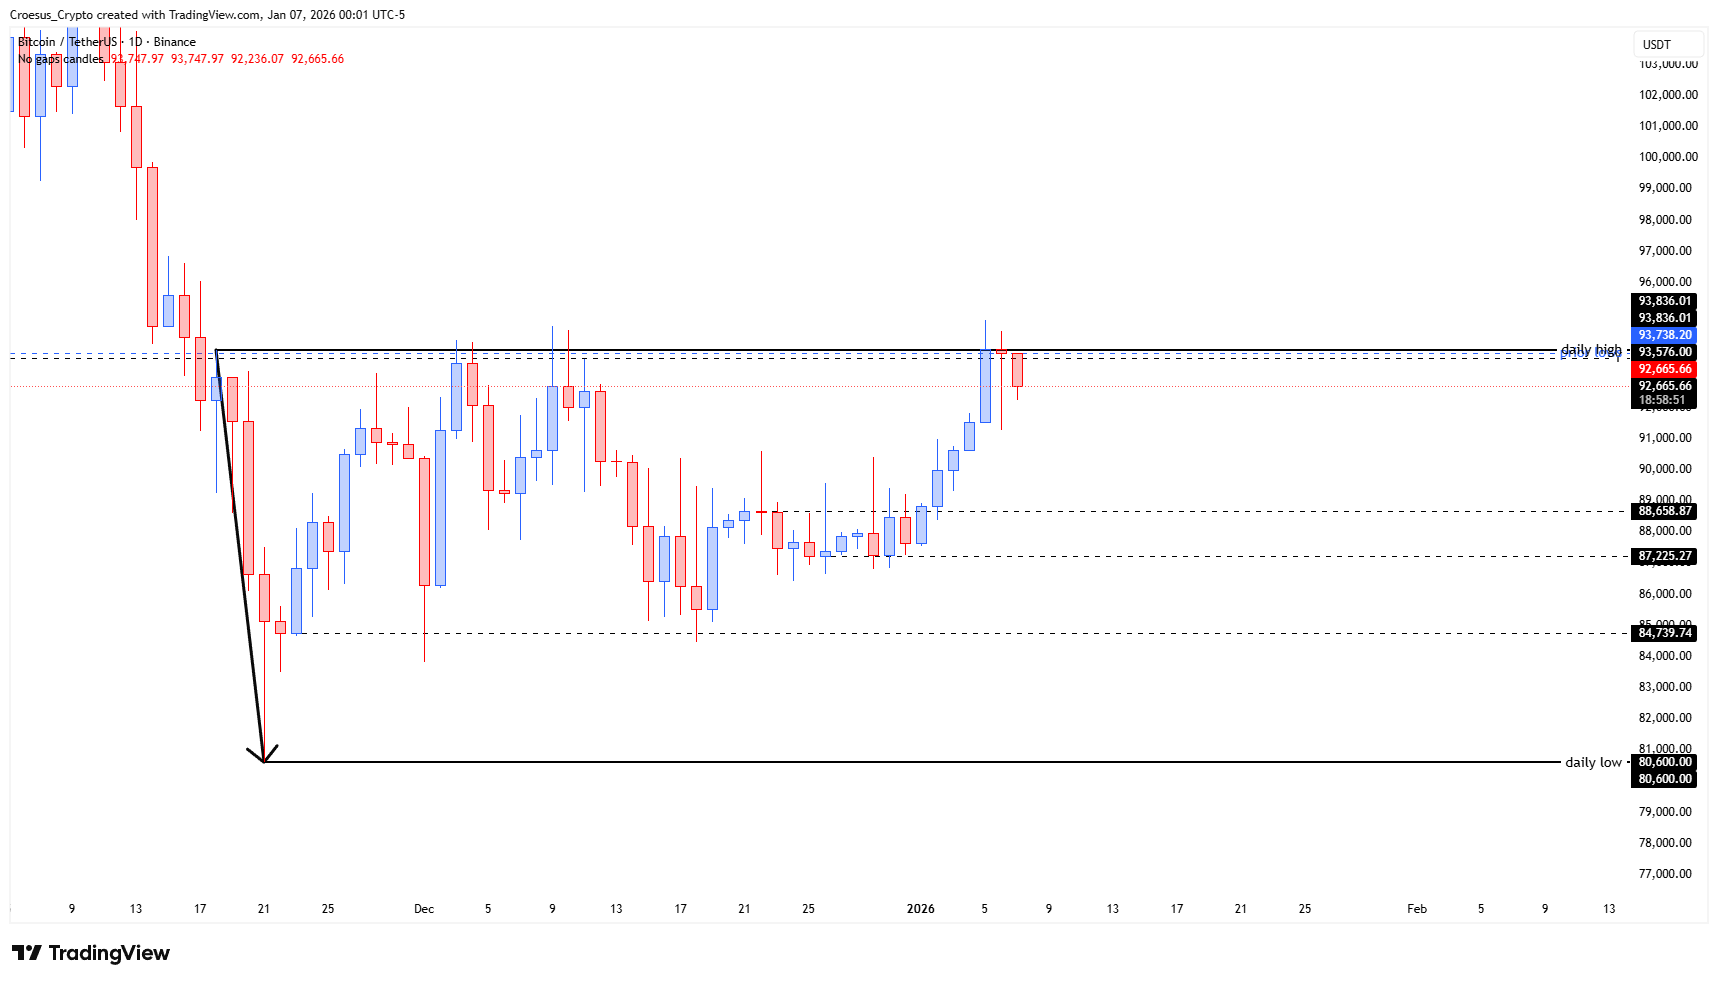
Bitcoin daily chart 06 January 2026 with Fibonacci retracement levels and confluence at 88,658 support.
Technical Analysis Key Points
- as we had a yearly close, we also look briefly at the yearly chart. We can notice that we are back at the opening of 2025. Covering the entire year of 2025 with one bullish week.
- we are also back against a key level weekly level (prior lows - blue line)
- Back to the daily chart, we just closed above the daily high, but closed back below it on the following, at this moment giving us no clear break of structure yet. Same with the weekly and yearly levels.
- Bearish case : this is a fake-out, trapping the bulls. We are back again in the long term range.
- Bullish case : eventhough it is a slight break, it is a break. But the conflluence between the daily high, the yearly level and the weekly level, all putting up resistance is too much for bullish immediate continuation and we could see a correction of the recent bullish uptrend. We see a possibility of price revisiting the first structure at $88.658,87. We can see a confluence with the 0.786 fib retracement level.
Market Structure Analysis
Structurally, BTC is testing a powerful multi-timeframe resistance cluster: the daily high, the key weekly support-turned-resistance, and the 2025 yearly open all sit in the same region. On the daily chart, price briefly closed above the daily high but then closed back below it the next day, signalling an indecisive break with no confirmed shift in structure yet.
In our technical analysis, this pattern can be read as either a failed breakout (bull trap) or the first attempt to clear the range that now needs a corrective pullback before continuation. For now, BTC remains inside its broader long-term range, with buyers and sellers fighting at the upper boundary.
Key Levels and Scenarios
Bearish scenario:
If the recent move proves to be a fake-out, bulls are trapped above the daily high and price rotates back into the range. In that case, a retracement toward the first structure support around 88.6k becomes likely, especially with confluence from the 0.786 Fibonacci retracement of the latest bullish leg.
Bullish scenario:
Even a “slight break” is still a break. Should BTC hold higher lows on any pullback and reclaim the daily/weekly/yearly cluster with strong closes, the current move may evolve into a genuine breakout, opening the door to new all-time-high expansion after the corrective phase.
Key levels to watch
Yearly open / 2025 level (~93.5k): Major yearly resistance and pivot for broader trend continuation.
Daily high zone (~93k): Local line in the sand; repeated failures favour range re-entry.
First structure support (~88.6k): Strong support with 0.786 Fibonacci confluence; key downside target for a corrective leg.
Mid-range supports (around 90k and 87.2k): Intermediate reaction zones within a deeper pullback.
Long-term range low (~80.6k): Loss of this level would strongly invalidate the bullish thesis and signal a larger distribution top.
Trading Implications
For traders, our BTC daily analysis suggests patience around this heavy resistance cluster: the cleaner setups are either short-term shorts targeting 88.6k on rejection, or higher-probability longs only after a corrective pullback and decisive reclaim of the daily/weekly/yearly resistance band, with tight risk management.
This is not financial advice; always do your own research and manage your risk appropriately.