


In this BTC daily analysis for January 2026, we focus on how price reacts after a failed breakout above the current daily and yearly highs. Our technical analysis highlights a clear momentum shift at resistance and the potential start of a corrective phase following a strong bullish leg.
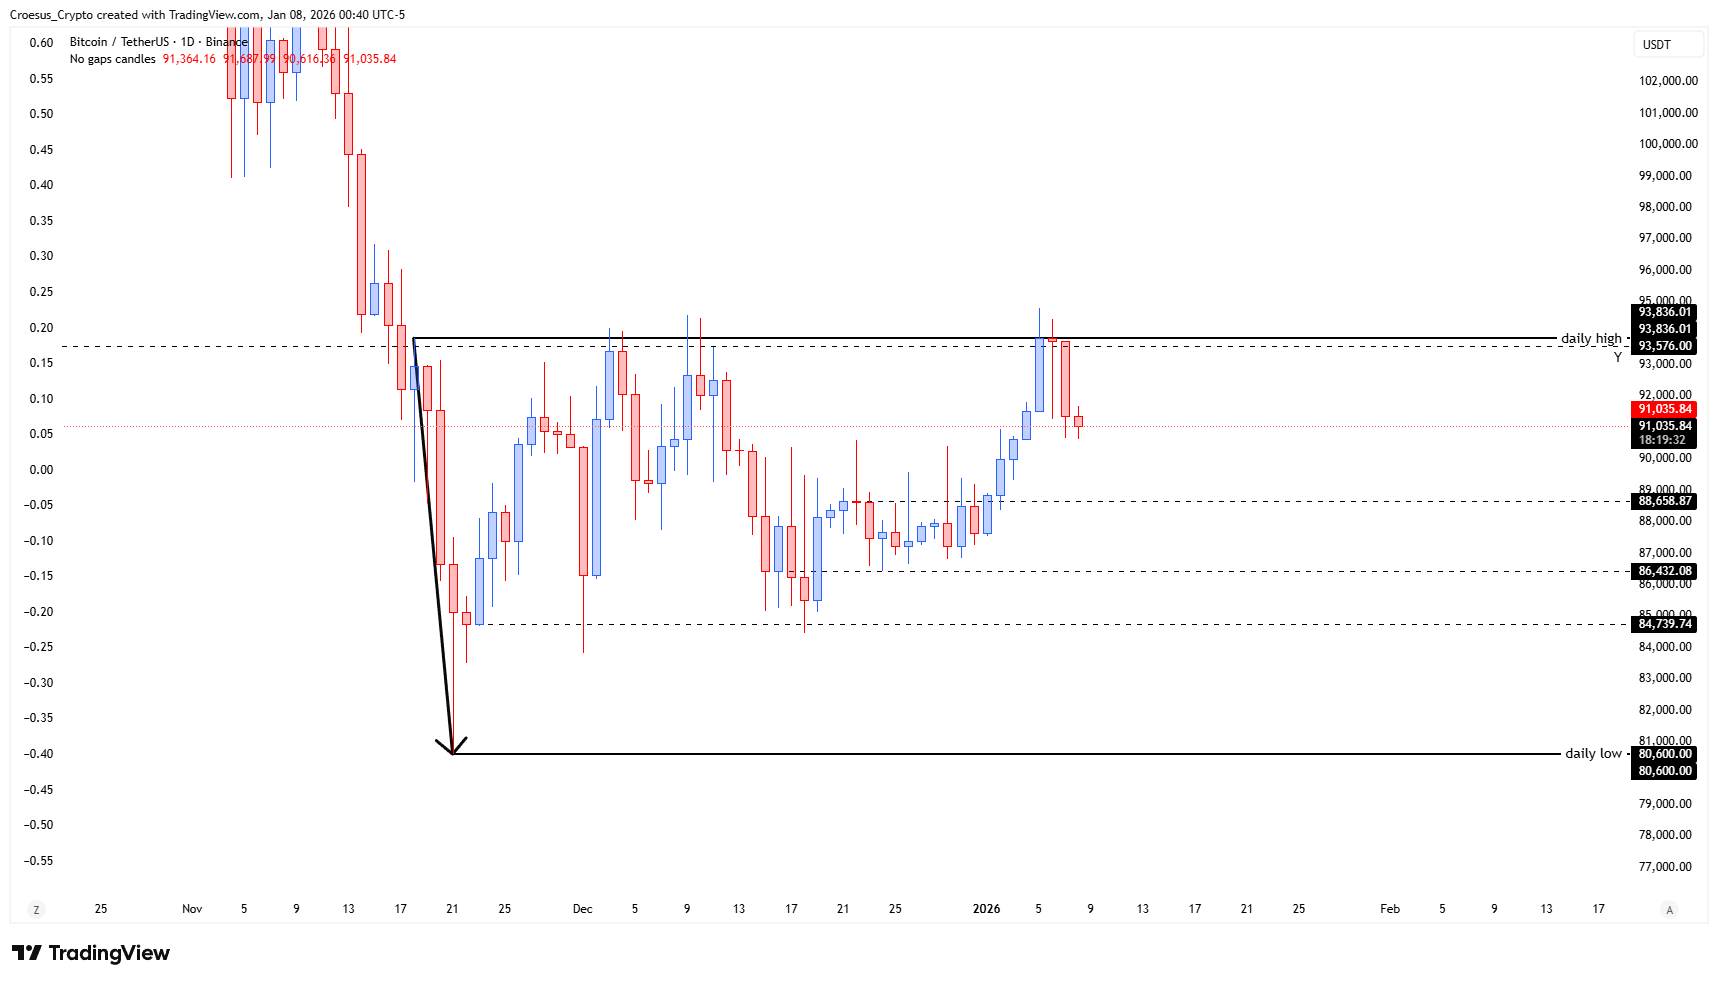
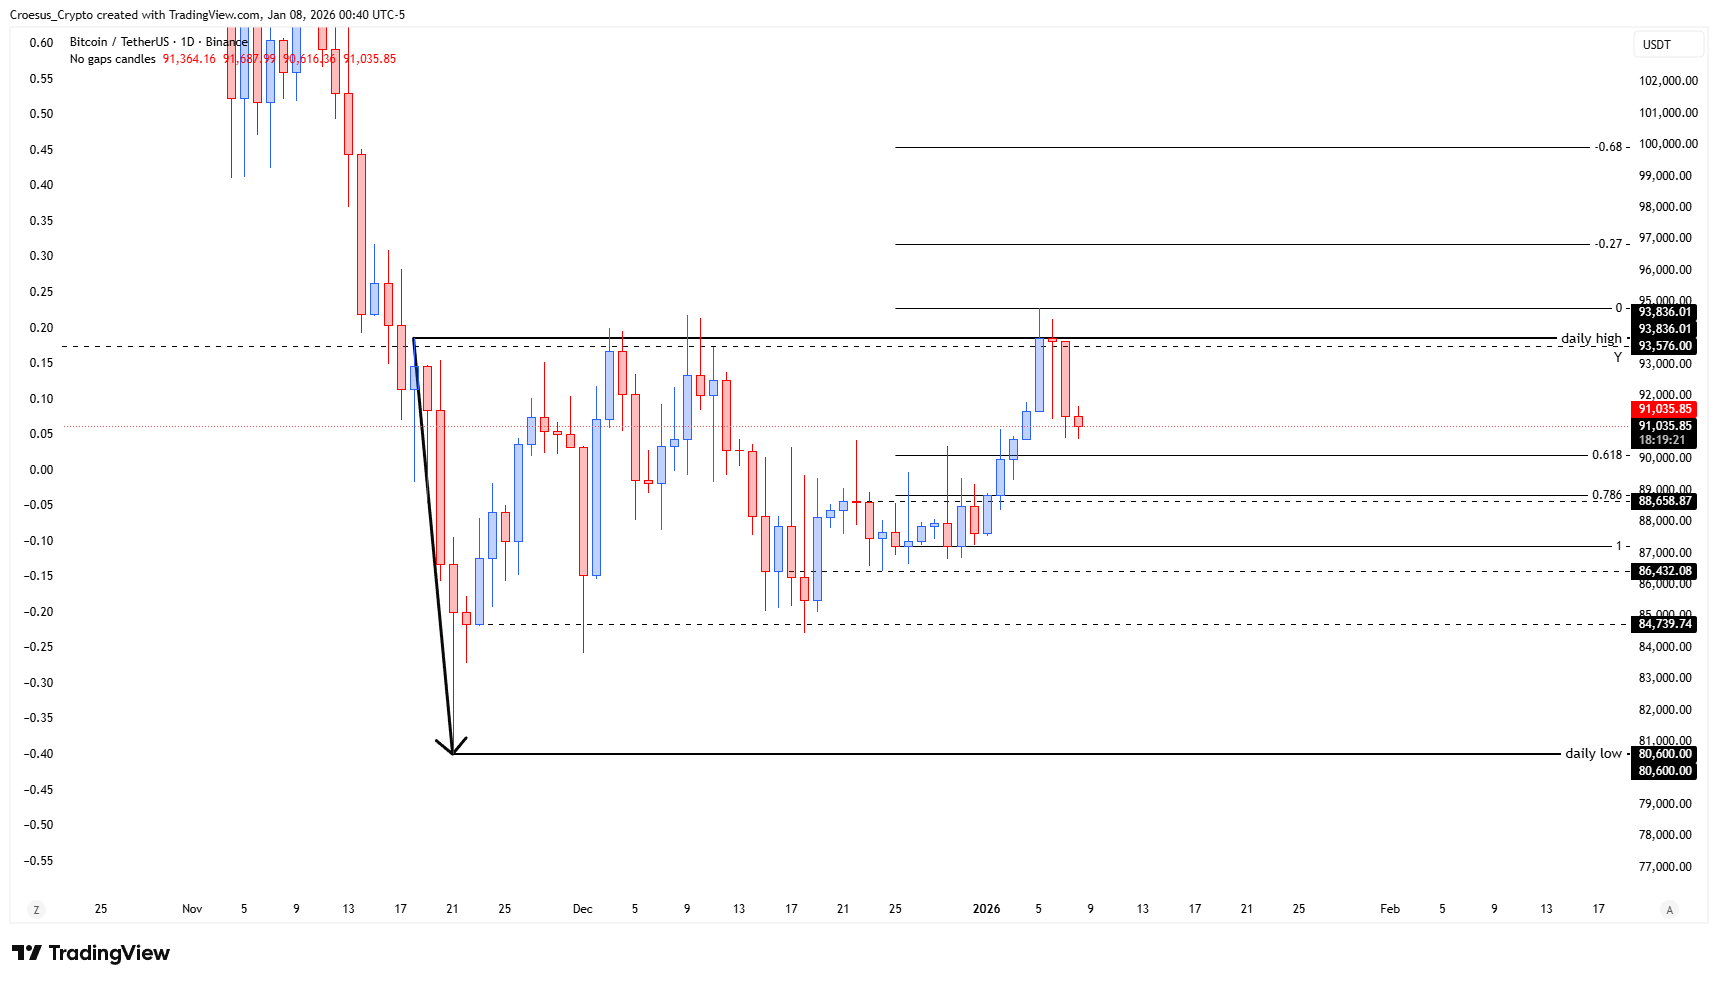
BTCUSDT daily chart 7 January 2026 with daily high, yearly high and range from 80,600 to 95,000 highlighted.
Technical Analysis Key Points
- after slightly breaking the daily high the price made a clear switch of momentum, getting rejected at daily high and Yearly high.
- After the bullish impulse of 6 consecutive days this could be considered as the corrective phase before further expansion. This might develop in an ABC correction, or even in a false breakout towards the -0.27.
Market Structure Analysis
The BTC daily analysis shows that buyers managed to push price slightly above the prior daily high around the 93,800–95,000 zone, which aligns with the yearly high. That breakout quickly failed, with a sharp rejection candle signalling a momentum switch from aggressive buying to profit-taking and fresh selling at resistance. This forms a classic support resistance flip area to monitor.
The rejection follows a strong 6-day bullish impulse from the 80,600 daily low towards the mid-90,000s. The current pullback likely represents a developing corrective structure within that larger uptrend. Using Fibonacci, the 0.618 retracement sits near 89,000 and the 0.786 zone around 88,658, in confluence with prior consolidation between 86,400 and 88,500. As long as price holds above this band, the broader bullish structure remains intact and an ABC correction scenario stays valid.
Key Levels and Scenarios
Bullish scenario: if BTC finds demand between 88,500 and 86,400 and then reclaims the daily high near 93,800, we can expect another expansion leg targeting the yearly high around 95,000 and potentially the -0.27 Fibonacci extension in the 97,000 area.
Key levels to watch:
97,000 (approx. -0.27 Fibonacci extension, potential false-breakout target).
95,000 (yearly high and major resistance).
93,800 (daily high; reclaiming confirms renewed bullish momentum).
89,000–88,658 (0.618–0.786 Fibonacci support zone).
80,600 (daily low and major downside invalidation level).
Trading Implications
Traders may look for long setups only if price stabilises within the 89,000–86,400 support zone with clear bullish confirmation, while any fresh rejection near 93,800–95,000 favours short-term mean-reversion trades; risk management should be based on volatility and clear invalidation beyond these levels.
This is not financial advice; always do your own research and manage your risk appropriately.