


BTC Marketcap / Bitcoin
BTC Daily Analysis 07/04/2026. This BTC daily analysis shows Bitcoin pushing higher into a key horizontal resistance zone, but our technical analysis still treats this move as corrective until price proves otherwise with a clean breakout and acceptance above resistance.
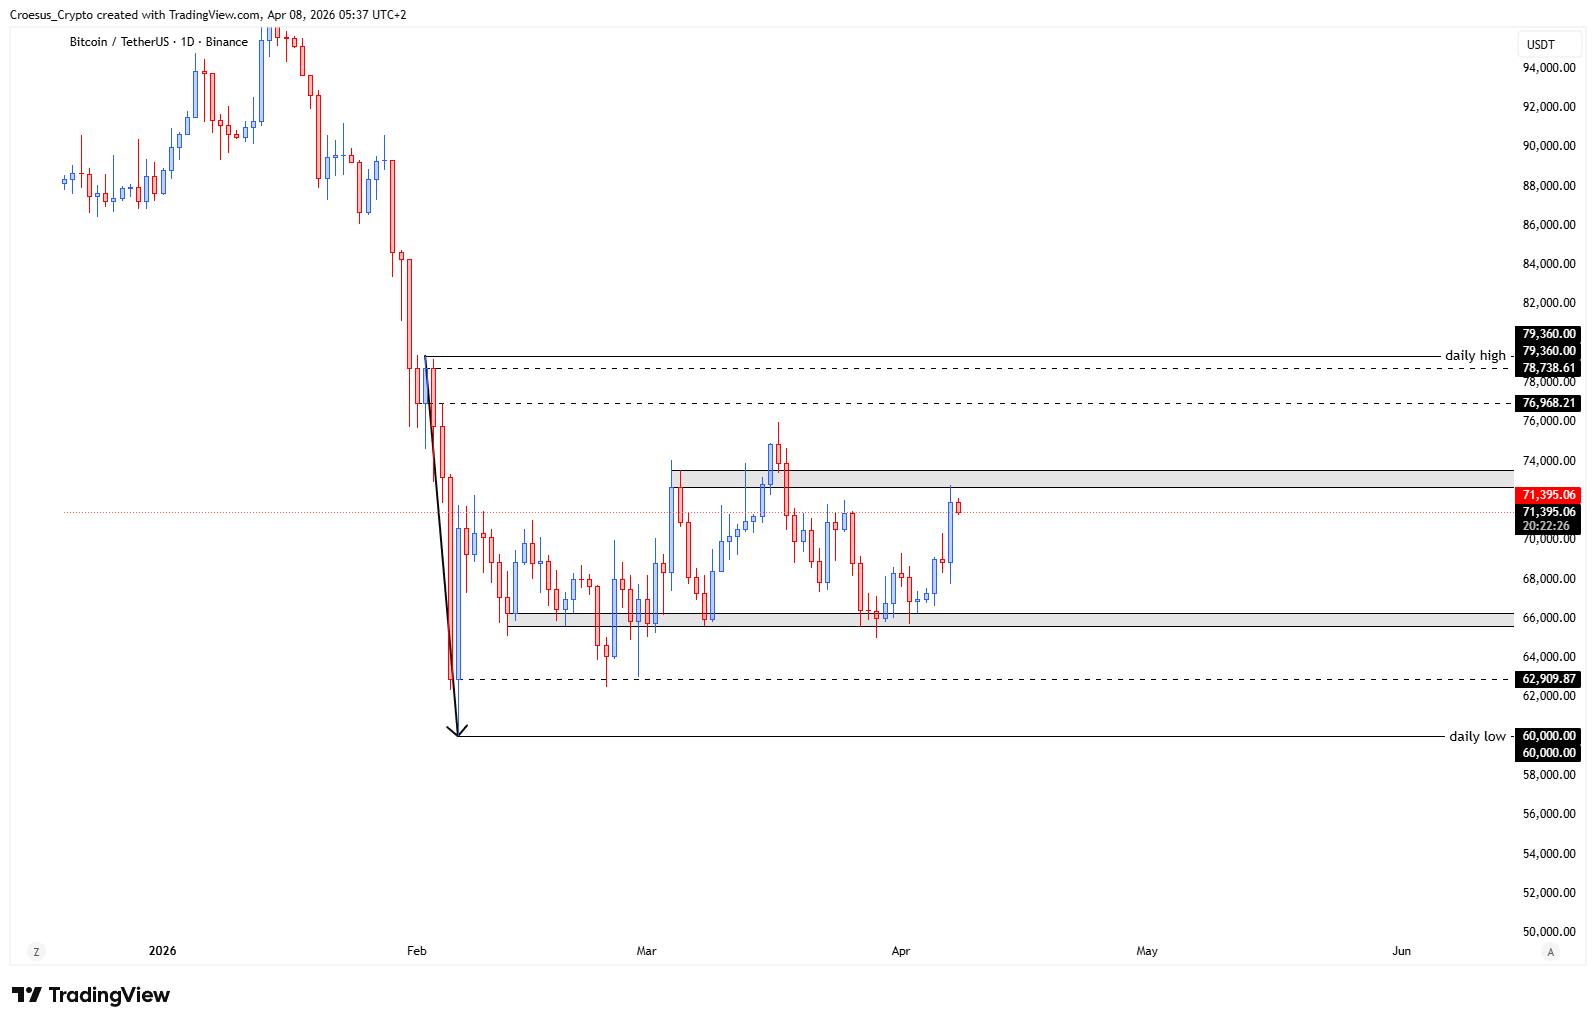
- The BTC price shows us a nice push up, but running into a key level. Just as we have our line in the sand defending our lows at 66.000$, we could have this level at 73.000$ acting as resistance. This level could act a shoulder level of a head and shoulders pattern.
- BTC price needs to show us its true coulours : are we breaking out bullish ? Or are we rejecting back into the range ?
Market Structure Analysis
Market structure remains bearish while price trades into a known ceiling and fails to convert that resistance into support. The push up into $73.000$ reads as a corrective leg within a broader downtrend context, especially as this zone is framed as potential shoulder resistance for a head and shoulders structure.
From a naked trading perspective, the chart is currently defined by two clear horizontal references: the “line in the sand” support around $66.000$ and overhead supply near $73.000$. Until we see a break of structure to the upside (breakout followed by acceptance), the higher-probability read is that price is rotating inside a range and testing liquidity on both sides.
Key Levels and Scenarios
For this BTC daily analysis, the decision point is whether $73.000$ flips into support or acts as a rejection level that sends price back into the range. A bearish continuation scenario stays in play if price rejects from resistance and returns toward the range low. A bullish scenario requires a convincing breakout and hold above resistance, invalidating the shoulder thesis.
- $73.000$ resistance: key supply zone and potential shoulder level (must flip to support for bullish continuation)
- $66.000$ support: “line in the sand” range low that needs to hold to avoid bearish expansion
- Acceptance vs rejection at $73.000$: primary trigger for breakout continuation or rotation back into the range
Trading Implications
While trend is bearish, chasing into resistance carries asymmetric risk unless structure confirms a breakout. Conservative traders typically wait for clear acceptance above resistance or a rejection setup back into range, while aggressive traders focus on the reaction at these support resistance levels with tight invalidation logic around the range boundaries.
This analysis is for informational purposes only and does not constitute financial advice.