


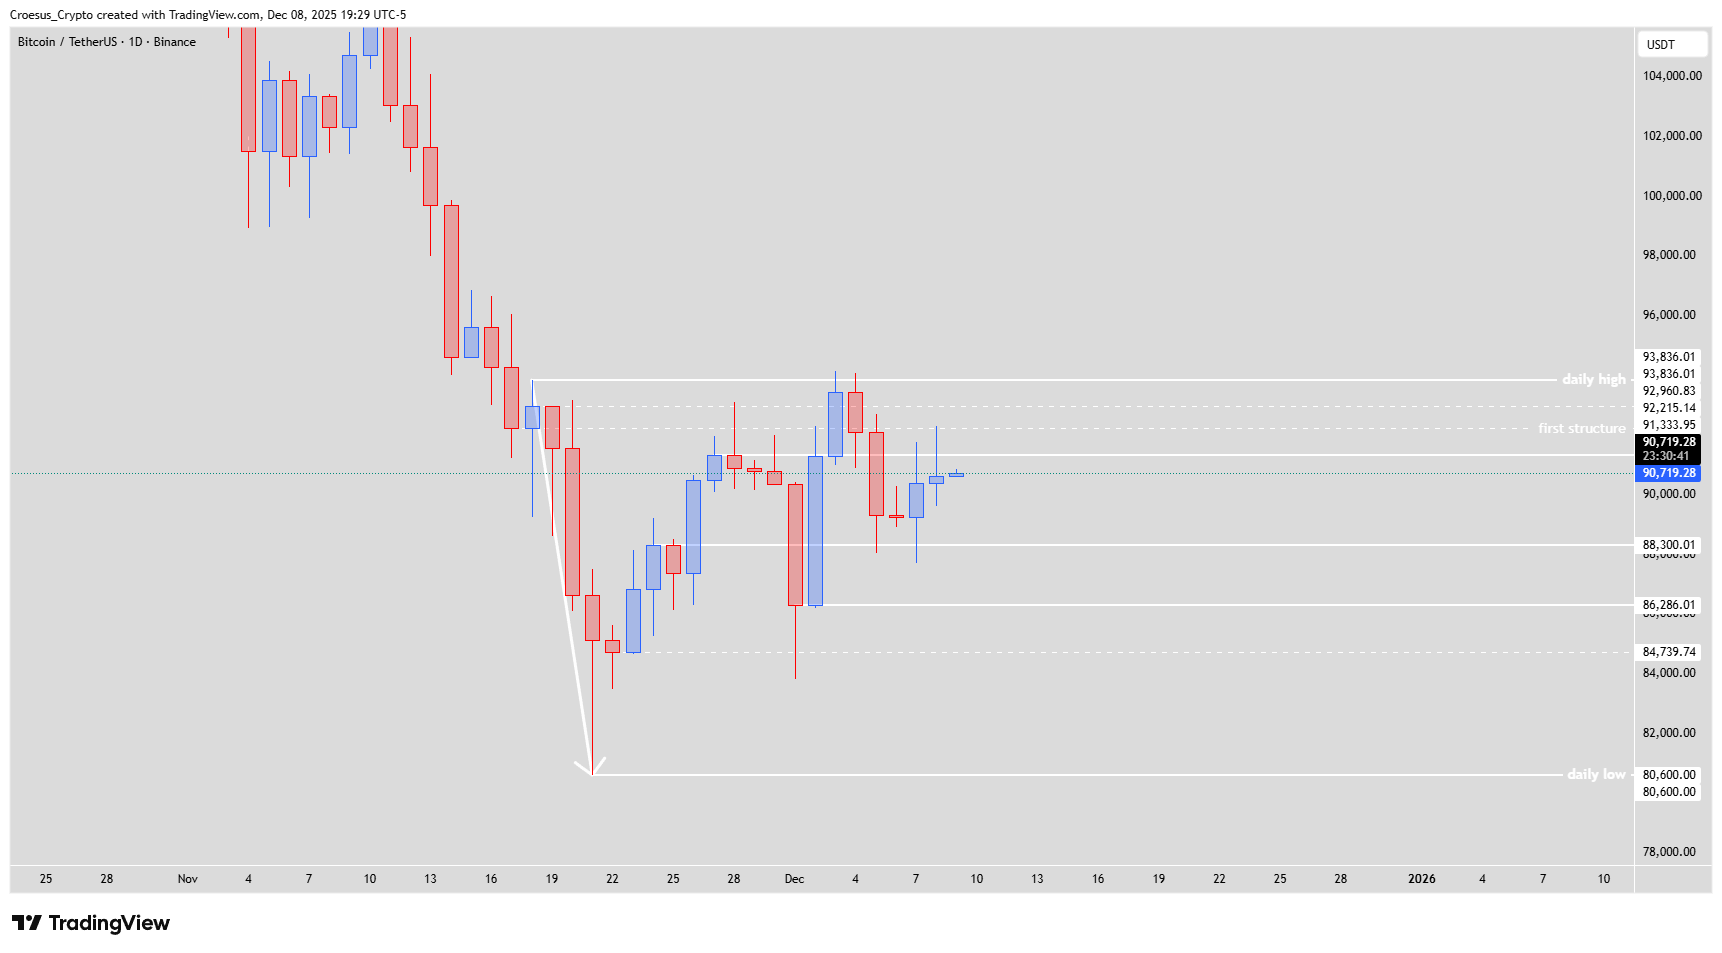
Bitcoin daily chart 8 Dec 2025 zoomed on IC touch and short-term consolidation below first structure resistance around $91,333
Technical Analysis Key Points
- After touching the IC we saw a bullish reaction.
- But for the second day in a row we are experiencing resistance @ $91.333.
- What if we want too much that the IC is the supportlevel where a bullish revival will happen ? Let's try to be neutral in our analysis.
- The predominant trend is still bearish. The daily high has not been broken yet. Everything within this range can be interpreted as noise.
- Marketmakers can use this range to mislead investors.
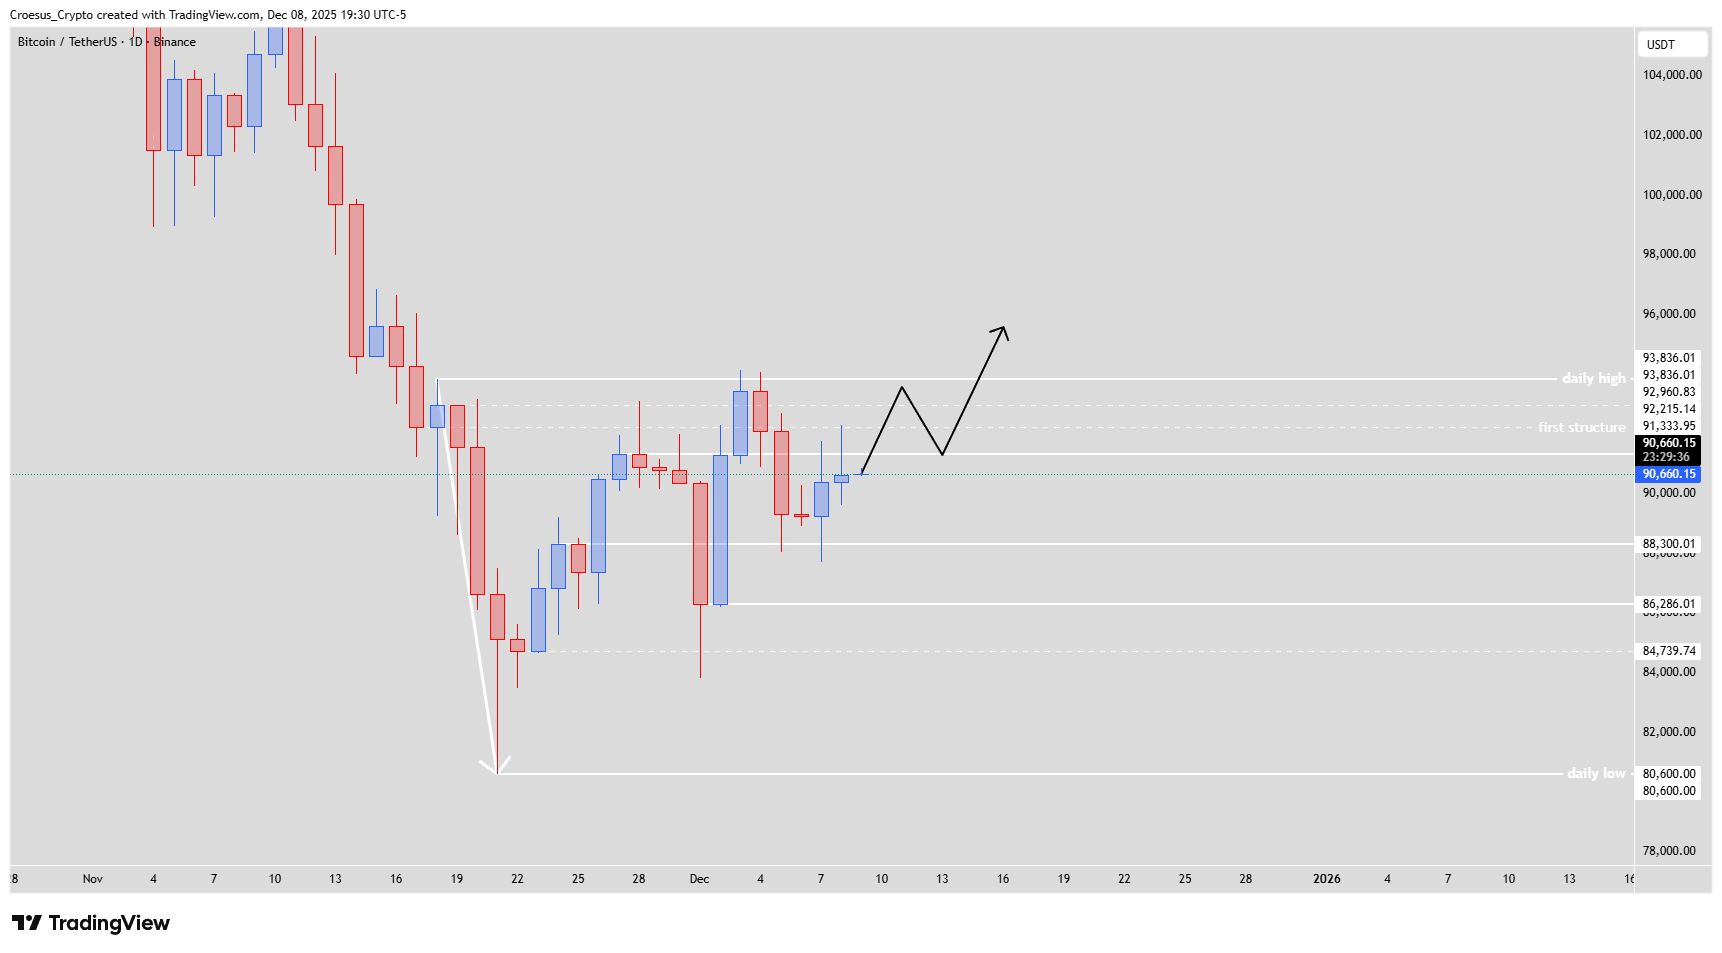
- Traders with a bullish bias could see a potential inverse head and shoulders pattern with the head @ $86.286,01 and the shoulders @ $88.300,01.
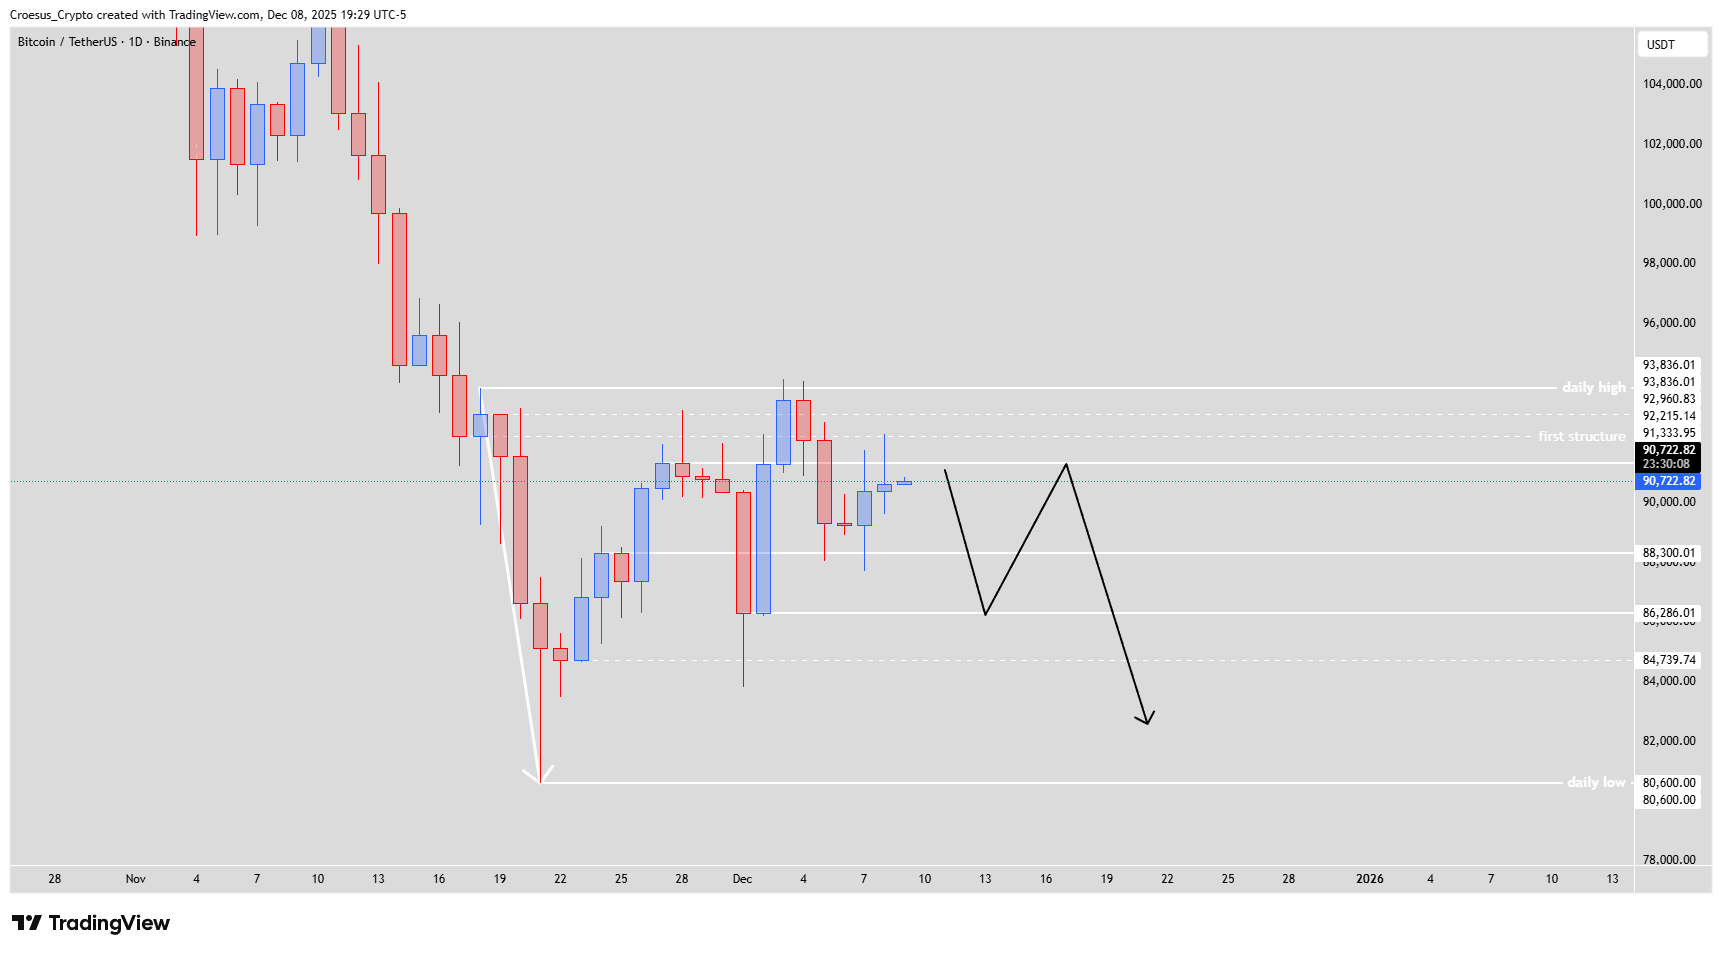
- Traders with a bearish bias, confluent with the predominant trend, could see a potential head and shoulders pattern with the head @ $93.836,01 (=daily high) and the shoulders @ $91.333,95.
Market Structure Analysis
This Bitcoin daily analysis highlights how price is oscillating between clear support-resistance bands after a strong bearish leg.
The IC tap triggered a bounce, but the market stalls at the first structure zone around $91,333, where sellers repeatedly step in.
Market makers can easily exploit this sideways range to trap both bulls and bears, reinforcing why we treat all action below the $93,836 daily high as noise relative to the broader downtrend. The bullish inverse head and shoulders outlines a possible bottoming process between roughly $86,286 and $88,300, while the bearish head and shoulders suggests continuation if the $91,333–$93,836 zone acts as distribution.
We do not see strong Fibonacci confluence at these levels yet, so pattern confirmation is key.
Key Levels and Scenarios
Key levels to watch:
$93.836,01 – Daily high and potential “head” of the bearish H&S.
$91.333,95 – Repeated resistance and potential shoulders of the bearish H&S.
$88.300,01 – Shoulder of the potential inverse H&S, first key support.
$86.286,01 – Head of the potential inverse H&S; a break below restores strong bearish momentum.
Trading Implications
Until Bitcoin breaks out of this structure, we treat the range as a trap zone, keeping position sizes conservative and using clearly defined invalidation around the $91,333–$93,836 resistance band or the $86,286 support, depending on bias.
This content is for educational purposes only and is not financial advice; always do your own research before making any investment or trading decisions.