


BTC Marketcap / Bitcoin
BTC daily analysis 08/04/2026. Bitcoin is showing a short-term cooldown after a strong push higher, while the broader context remains bearish as price trades within a developing corrective structure.
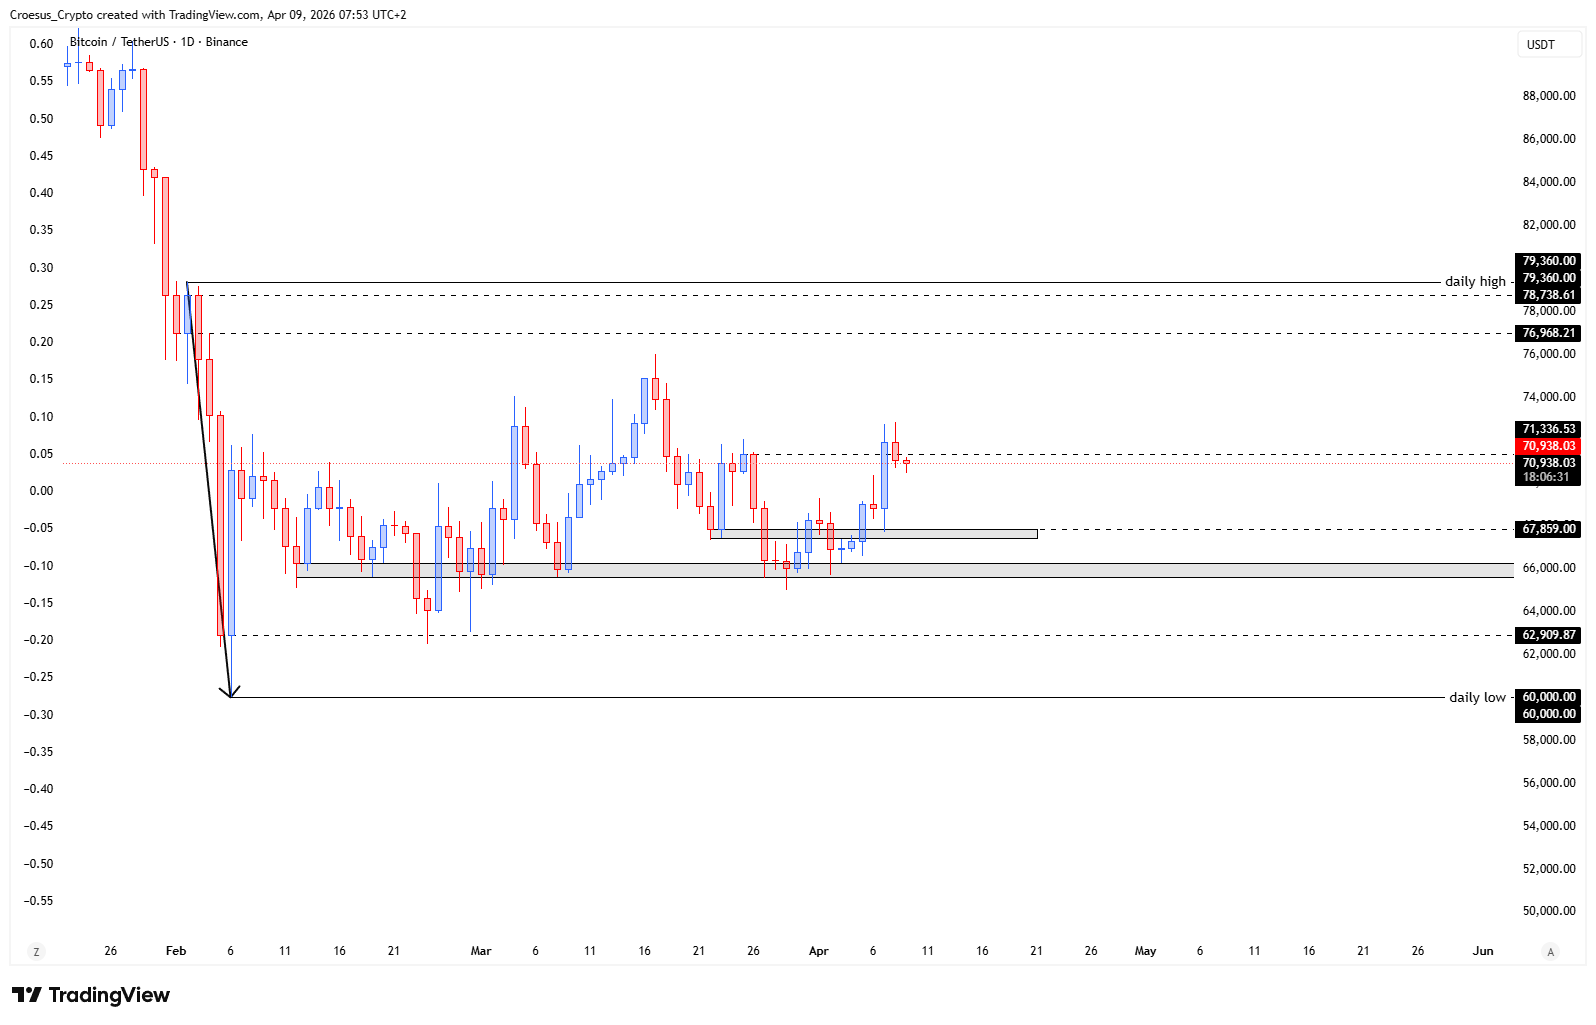
- After the significant push up we can see that the BTC price is taking some relief.
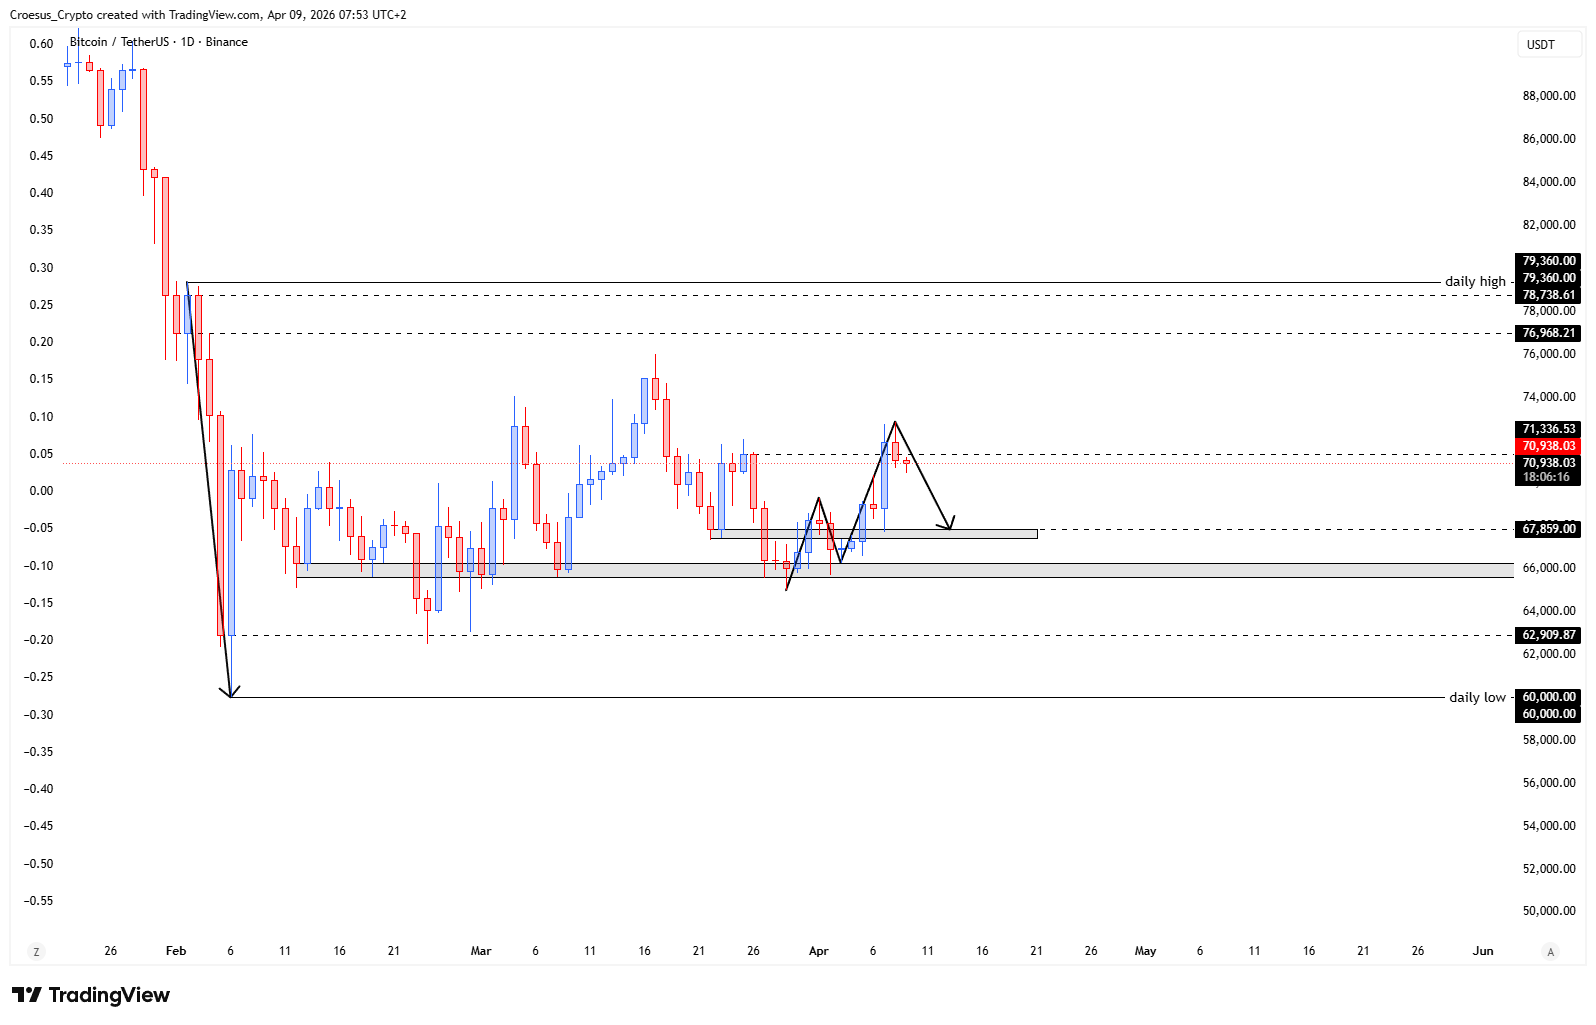
- If we zoom in on the price structure of the last weeks, we can see two pattern being formed at this moment. We first have an inversed head and shoulders pattern with double bottom. And then we can see a bullish M where we can see a pullback at this moment of the third impulsive leg.
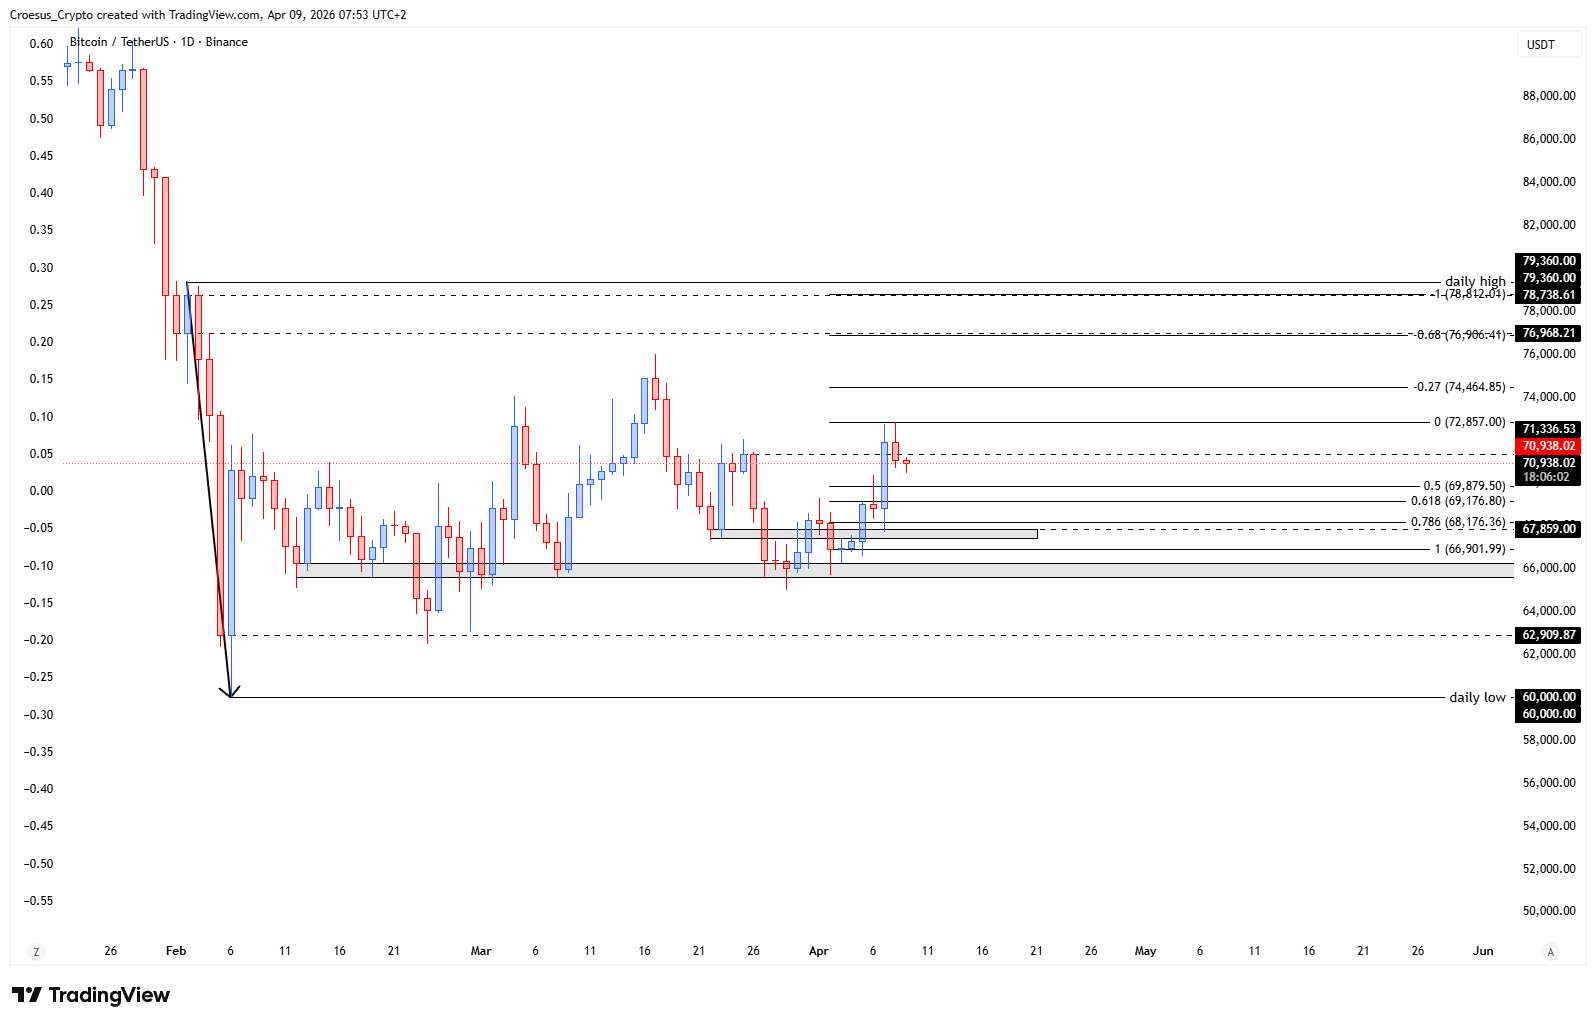
- If we take the Fibonacci retracement of the last leg up, we can see the 0.786 just above the daily entry zone and the -0.68 and -1 take profit levels aligning perfectly with the daily highs
Market Structure Analysis
From a market structure perspective, BTC daily analysis focuses on whether this current “relief” is a clean corrective leg or the start of a deeper reversal back into the bearish trend. The inverse head and shoulders with a double bottom suggests buyers are defending a local base, typically signalling absorption after a sell-off. At the same time, the bullish M and the pullback during the third impulsive leg frames the recent advance as a sequence of impulses and corrections rather than a single vertical move. In a bearish environment, these bullish patterns often act as corrective structures that either break higher into a short squeeze or fail into a continuation move lower, making nearby support resistance the key decision area.
Key Levels and Scenarios
For this BTC daily analysis, the Fibonacci context is the main roadmap. A bullish scenario holds the daily entry zone and reclaims the recent daily highs, confirming that the pullback is corrective and that buyers can expand into the next leg. A bearish scenario develops if price loses the structure supporting the inverse head and shoulders, turning the current relief into distribution and opening space for continuation with the dominant trend.
- 0.786 Fibonacci retracement zone just above the daily entry zone as the key reaction area
- Daily entry zone as the structural line in the sand for the current pullback
- Daily highs as the primary resistance/liquidity reference
- -0.68 take profit level aligning with the daily highs (extension reference)
- -1 take profit level aligning with the daily highs (extension reference)
This analysis is for informational purposes only and does not constitute financial advice.