


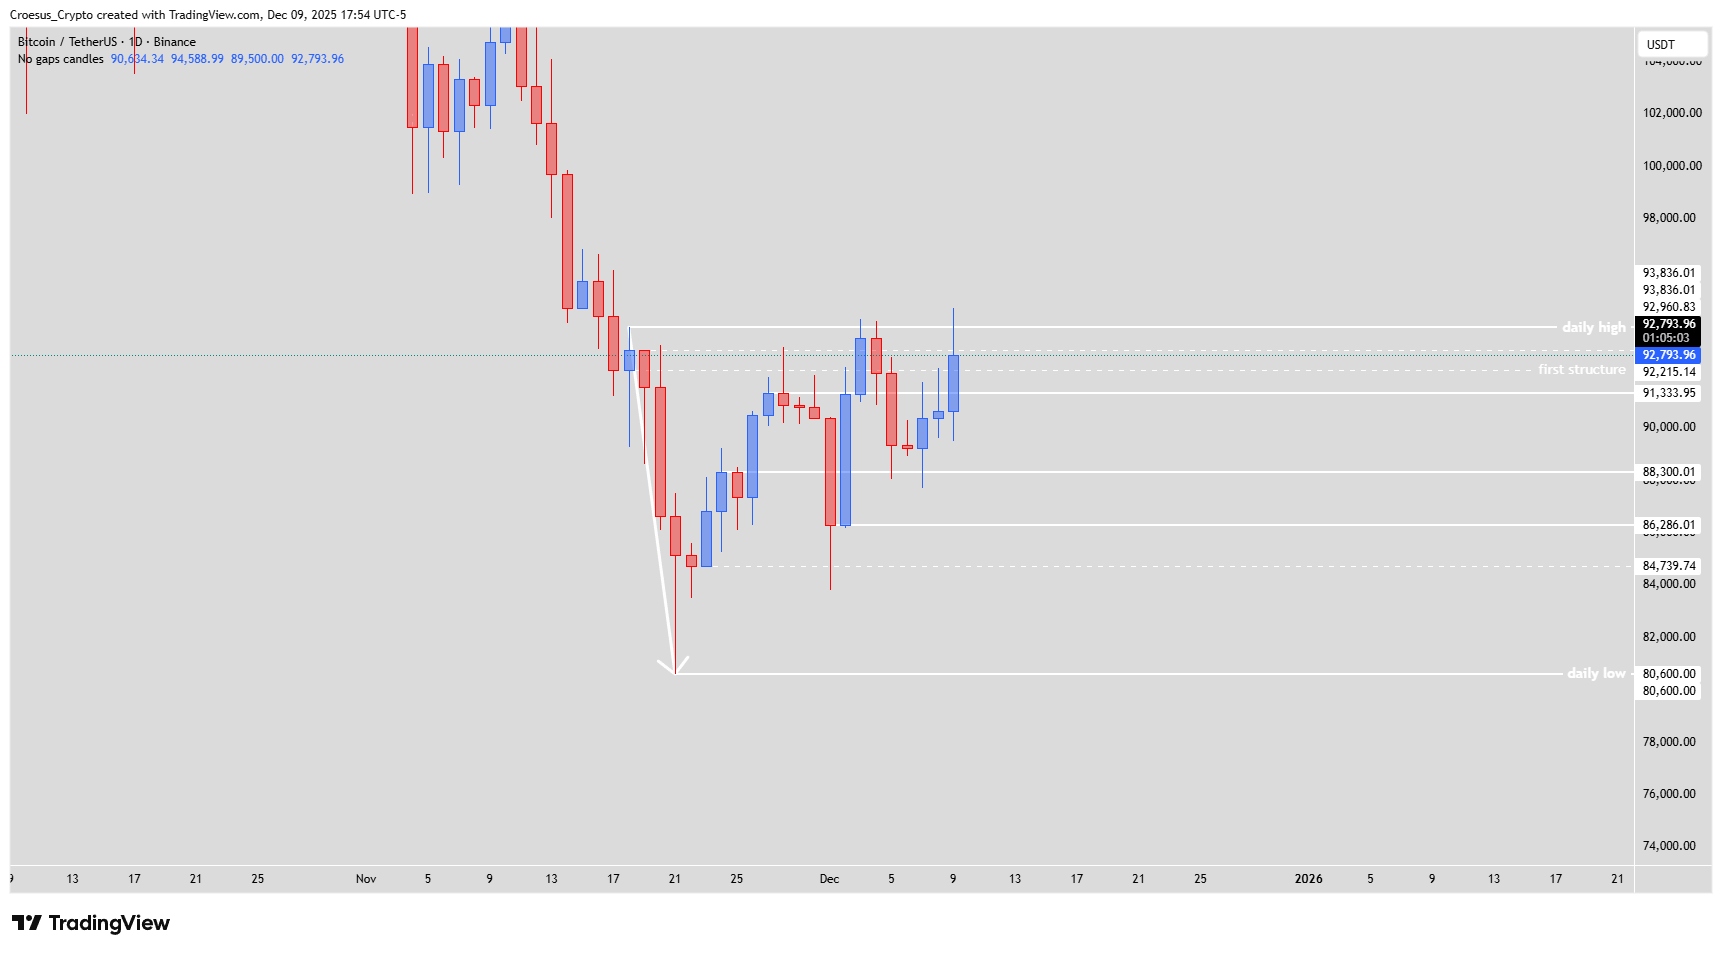
In this Bitcoin daily analysis for 09 December 2025, we saw price cleanly break above the $91,333 first structure before pushing into the daily high near $93,836 and getting rejected. Despite this short-term strength, the daily high remains intact, so our technical analysis still treats the overall daily trend as bearish. Price is trading inside a wide range between the daily high resistance and the 80k–86k support area, where both bullish and bearish head and shoulders structures are forming.
Bitcoin daily chart 9 Dec 2025 showing break of $91,333 first structure and broader range between daily high and daily low.
Technical Analysis Key Points
- Today the price clearly broke the $91.333-level, pushing higher until the daily high, getting rejected there.
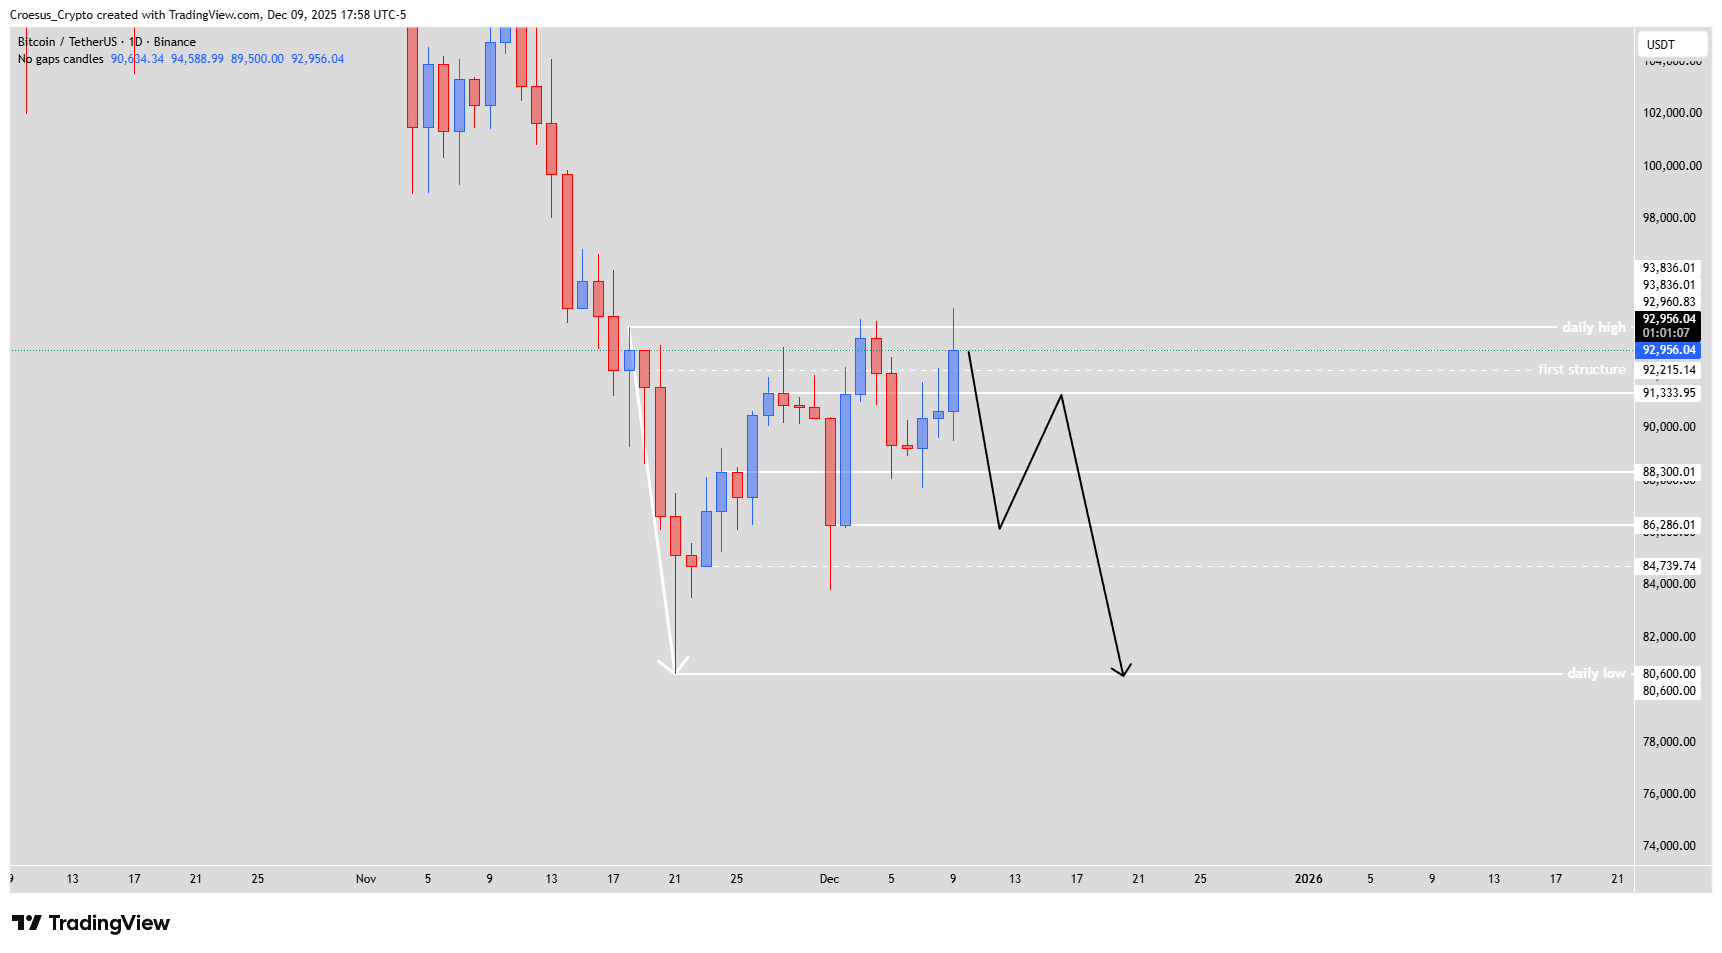
- The daily still hasn't been broken yet, so the trend remains predominantly bearish still. This could still act as a double top of a head and shoulders level.
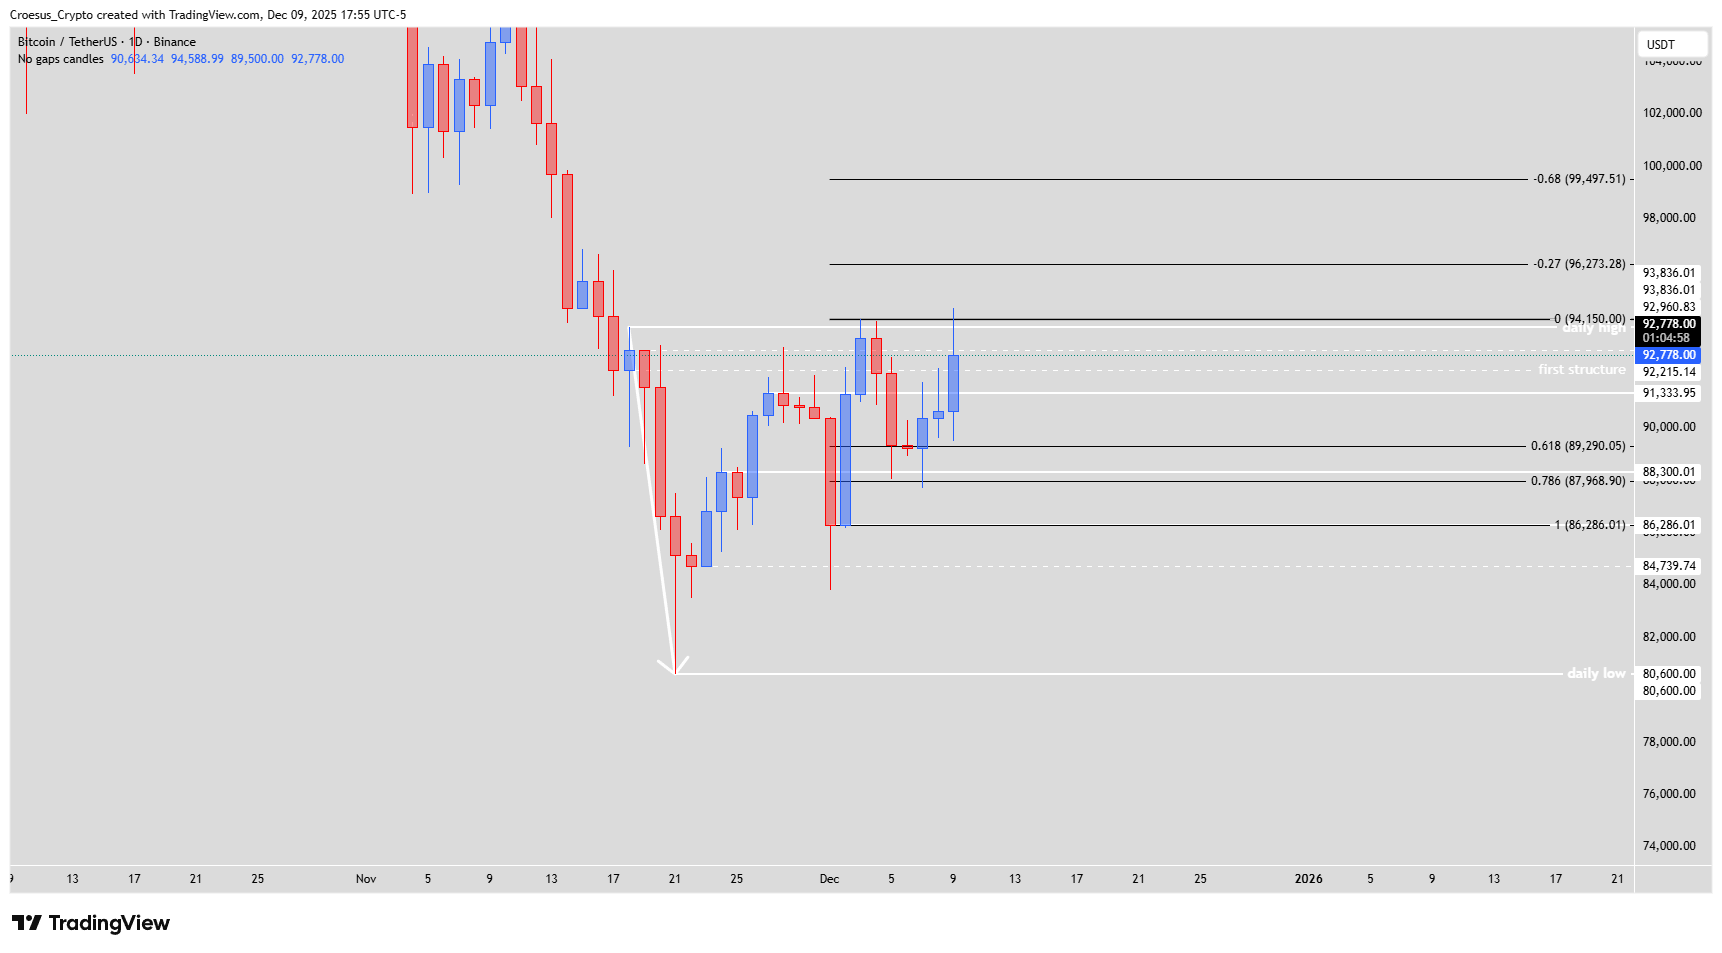
- Traders with a bullish bias could see a potential inverse head and shoulders pattern with the head @ $86.286,01 and the shoulders @ $88.300,01.
- Traders with a bearish bias, confluent with the predominant trend, could see a potential head and shoulders pattern with the head @ $93.836,01 (=daily high) and the shoulders @ $91.333,95.
Market Structure Analysis
Our Bitcoin daily analysis highlights how the rejection at the daily high keeps structure capped, turning $93,836 into a critical resistance and potential double-top or H&S head. The prior breakout through $91,333 converts that zone into key support resistance flip and the right shoulder area for the bearish pattern. On the downside, the $86,286 region marks the head of the potential inverse head and shoulders, reinforced by nearby Fibonacci retracement levels, while $88,300 acts as shoulder support. As long as candles close below the daily high, the market structure favours a corrective bounce within a dominant downtrend, with liquidity likely to be engineered around these competing patterns.
Key Levels and Scenarios
Bullish scenario: buyers need a decisive daily close above the $93,836 daily high to invalidate the immediate bearish H&S and open room for continuation toward higher resistance and extended Fibonacci targets.
Key levels to watch:
$93,836 – daily high, double-top / bearish H&S head and main resistance.
$91,333 – first structure, prior resistance now support and bearish right-shoulder zone.
$88,300 – inverse H&S shoulder support and intermediate demand.
$86,286 – inverse H&S head and major swing low within the current structure.
$80,600 – broader daily low and final downside liquidity pool if structure breaks.
Trading Implications
Given the conflicting head and shoulders setups, traders may wait for a confirmed break of either $93,836 or the $86,286–$80,600 support band, manage risk tightly around these support resistance zones, and size positions conservatively until direction is clearer.
This content is for educational purposes only and is not financial advice; always do your own research before making any investment or trading decisions.