


BTC Marketcap / Bitcoin
BTC daily analysis 09/02/2026. Bitcoin is trading in a bearish environment after a corrective rebound failed into prior structure, keeping the market biased toward a retest of the lows unless buyers can reclaim key support resistance on the weekly chart.
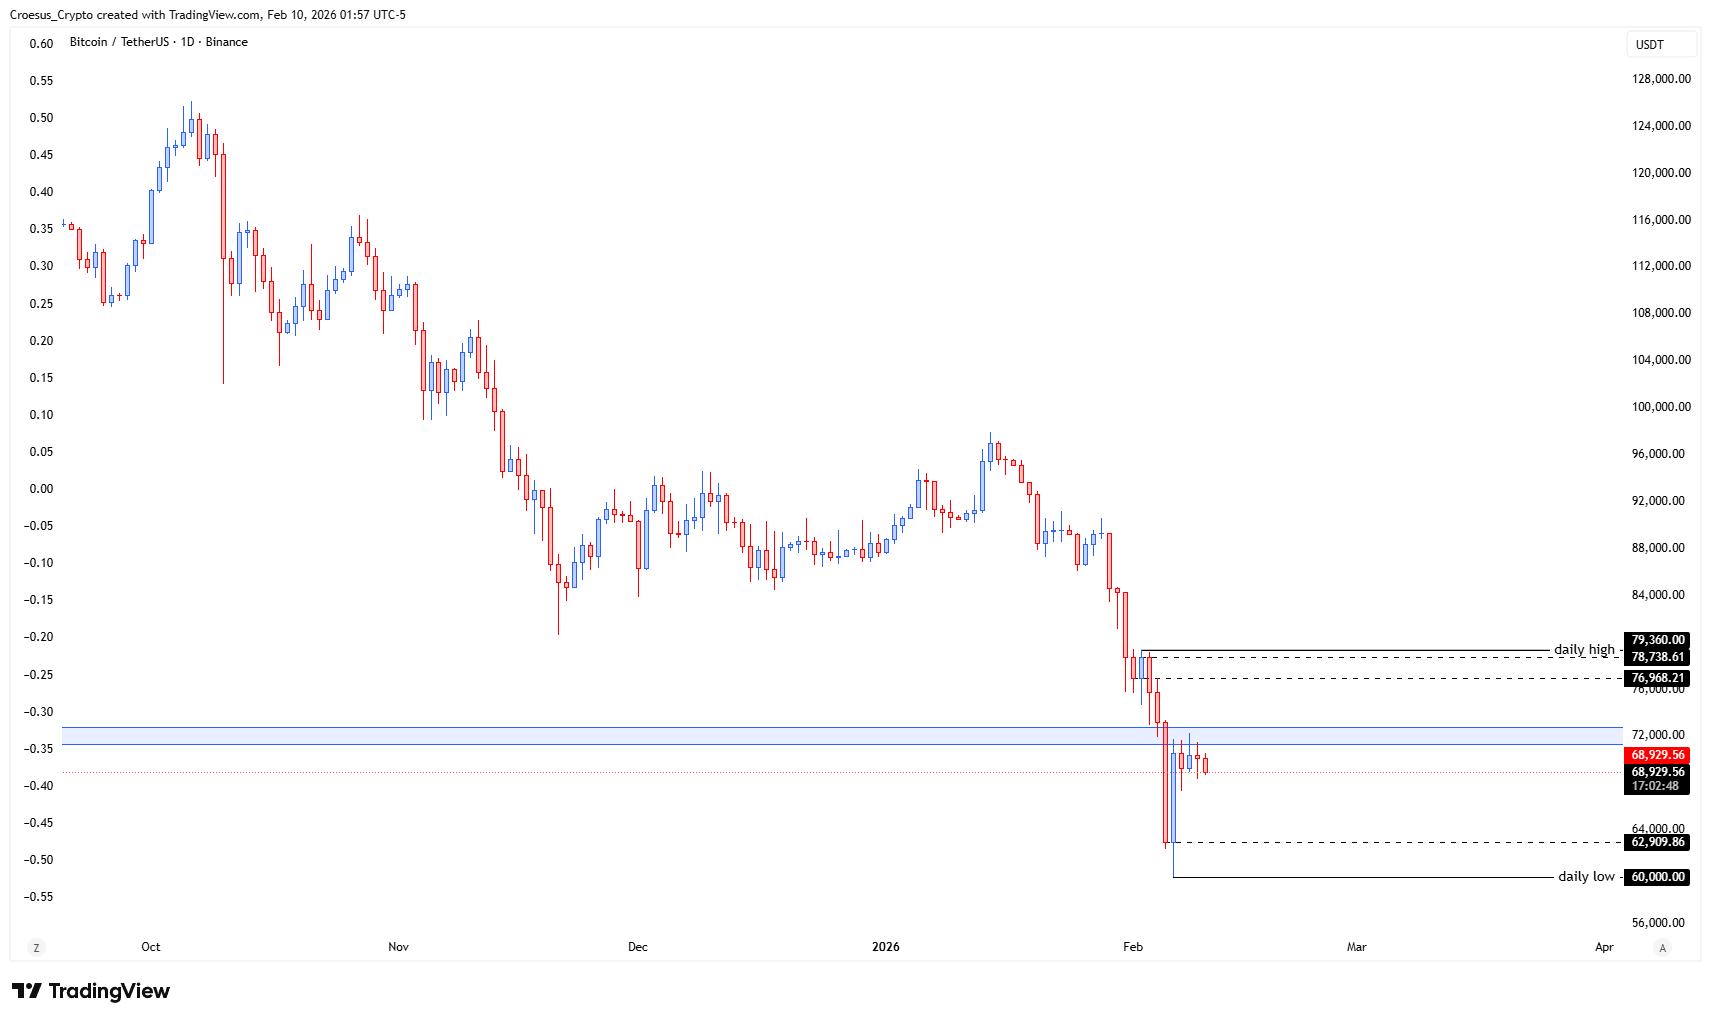
- Price made a bullish corrective move but was capped at a broken weekly support zone, flipped into a resistance
- This could be part of an ABC correction where we would expect price to retest the lows now, before making a larger bullish correction. But this larger bullish correction could mislead and entise FOMO buyers again
- As the fib 0.618 retracement level has been activated, this could simply playout also as a bearish W.
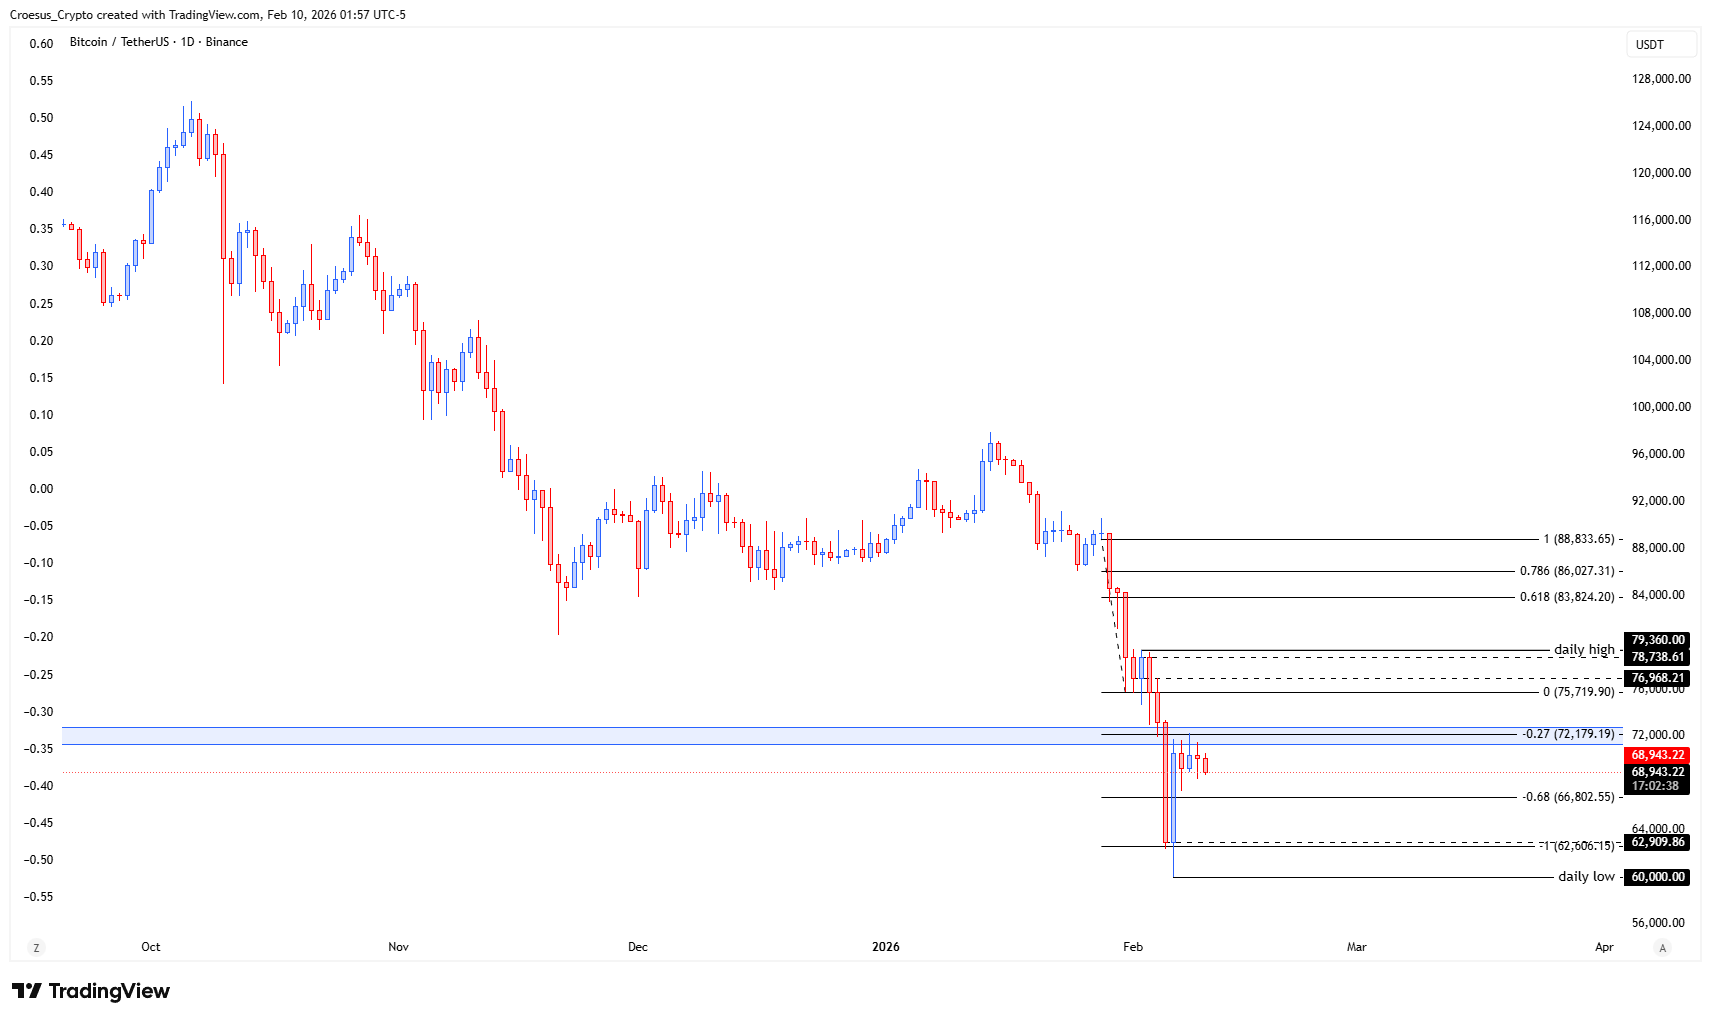
Market Structure Analysis
Our BTC daily analysis focuses on the failed corrective leg into a broken weekly support zone that is now acting as clean horizontal resistance. Structurally, this reads as a corrective structure inside a broader bearish trend: price rallied, met supply at former support, and showed that the market still respects that flip as a decision point. The mention of an ABC correction keeps the expectation anchored to a downside retest of the prior swing low/liquidity area before any larger corrective rebound can develop. With the 0.618 Fibonacci retracement “activated,” the current area functions as a typical retracement sell-zone; if sellers defend it, continuation back toward the lows becomes the higher-probability path. The “bearish W” scenario reinforces the idea that the market can print a deceptive recovery leg that attracts late buyers before rolling over again.
Key Levels and Scenarios
In this bearish technical analysis, the immediate question is whether price remains rejected from the broken weekly support turned resistance, or whether it can reclaim that zone and shift structure. A bearish continuation scenario holds as long as price fails to close back above that flipped level, keeping a lows-retest as the primary outcome. A bullish corrective scenario requires acceptance back above the flipped zone and sustained strength beyond the 0.618 Fibonacci area to reduce the “bearish W” risk.
- Broken weekly support zone (now resistance): key rejection/acceptance pivot for support resistance
- Prior lows: primary downside retest objective if rejection holds
- 0.618 Fibonacci retracement: key retracement zone that can cap corrective strength
- The corrective swing high into resistance: invalidation point for immediate bearish continuation if reclaimed
This analysis is for informational purposes only and does not constitute financial advice.