


BTC Marketcap / Bitcoin
BTC weekly analysis 10 February 2026. Bitcoin remains in a bearish environment, with the latest upside push reading as corrective and currently facing clear supply at prior support that has flipped into resistance.
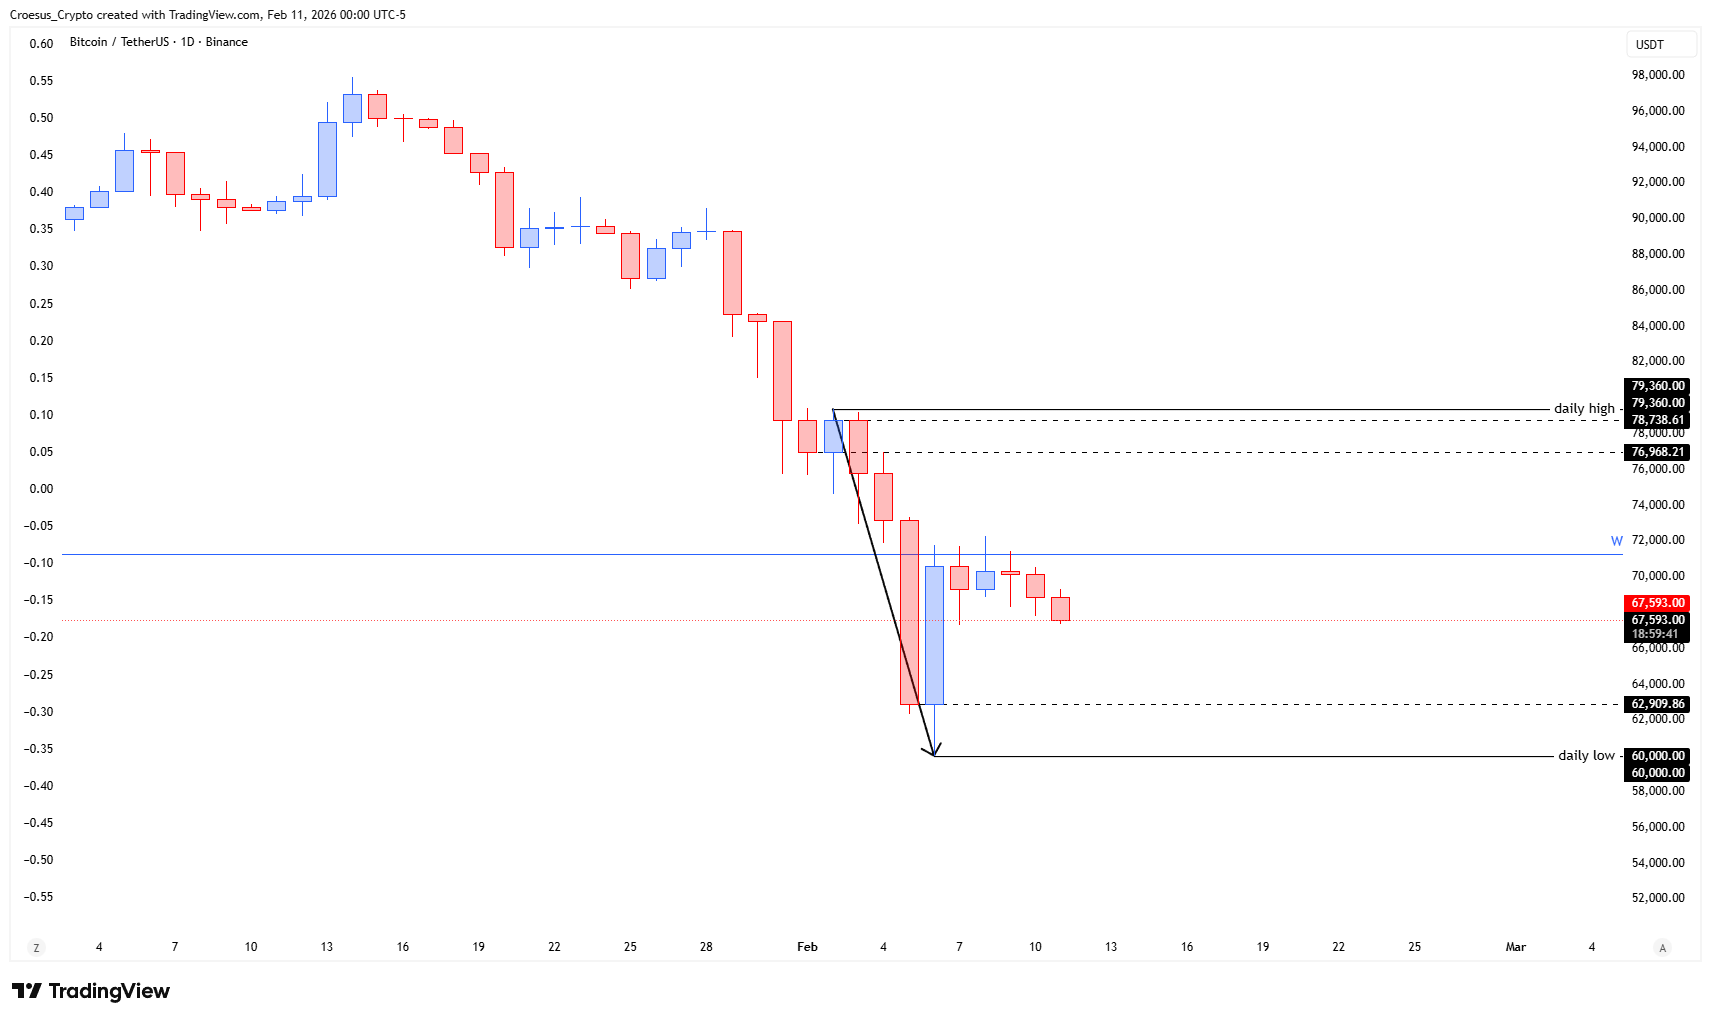
- Price made a bullish corrective move but was capped at a broken weekly support zone, flipped into a resistance. The rejection is playing out.
- This could be part of an ABC correction where we would expect price to retest the lows now, before making a larger bullish correction. But this larger bullish correction could mislead and entise FOMO buyers again
- As the fib 0.618 retracement level has been activated, this could simply playout also as a bearish W.
Market Structure Analysis
From a market structure perspective, our BTC daily analysis reads the latest rally as a counter-trend leg into a key horizontal supply zone: the “broken weekly support zone” that now acts as resistance. This is classic support resistance behavior, where prior demand becomes a ceiling after a breakdown. The ongoing rejection suggests sellers are still defending that level and that the move up lacks impulsive follow-through.
Structurally, the mention of an ABC correction frames the current leg as a corrective sequence inside a broader bearish trend, where price often revisits the range low/swing low before any meaningful relief bounce develops. The 0.618 Fibonacci retracement being “activated” reinforces that the corrective rally has reached a common retracement area where bearish continuation frequently resumes, keeping downside risk active as long as price stays capped beneath that flipped zone.
Key Levels and Scenarios
In this BTC daily analysis, the bearish scenario remains favored while price is rejected from the prior weekly support-turned-resistance. A continuation lower is reinforced if price rolls over and starts pressuring the recent lows again. A bullish alternative requires reclaiming and holding above that broken weekly support zone, converting it back into demand, which would shift structure from corrective to more constructive.
- Broken weekly support zone (now resistance): key cap; reclaim would weaken the bearish case
- Recent lows: primary downside objective if the rejection continues
- 0.618 Fibonacci retracement: inflection area that aligns with the current rejection
- Rejection swing high: local invalidation reference for the current downside pressure
Trading Implications
With structure still leaning bearish, aggressive participants typically focus on rejection confirmation at resistance, while conservative traders often wait for either a clear breakdown toward the lows or a clean reclaim and retest of resistance as support. The main risk is a larger bullish corrective leg that can trigger FOMO before the broader bearish structure fully resolves.
This analysis is for informational purposes only and does not constitute financial advice.