BTC Marketcap / Bitcoin
BTC daily analysis 10/03/2026. Bitcoin is testing a key resistance inflection after a neckline retest, with price closing slightly above that level while the broader trend remains bearish and fragile.
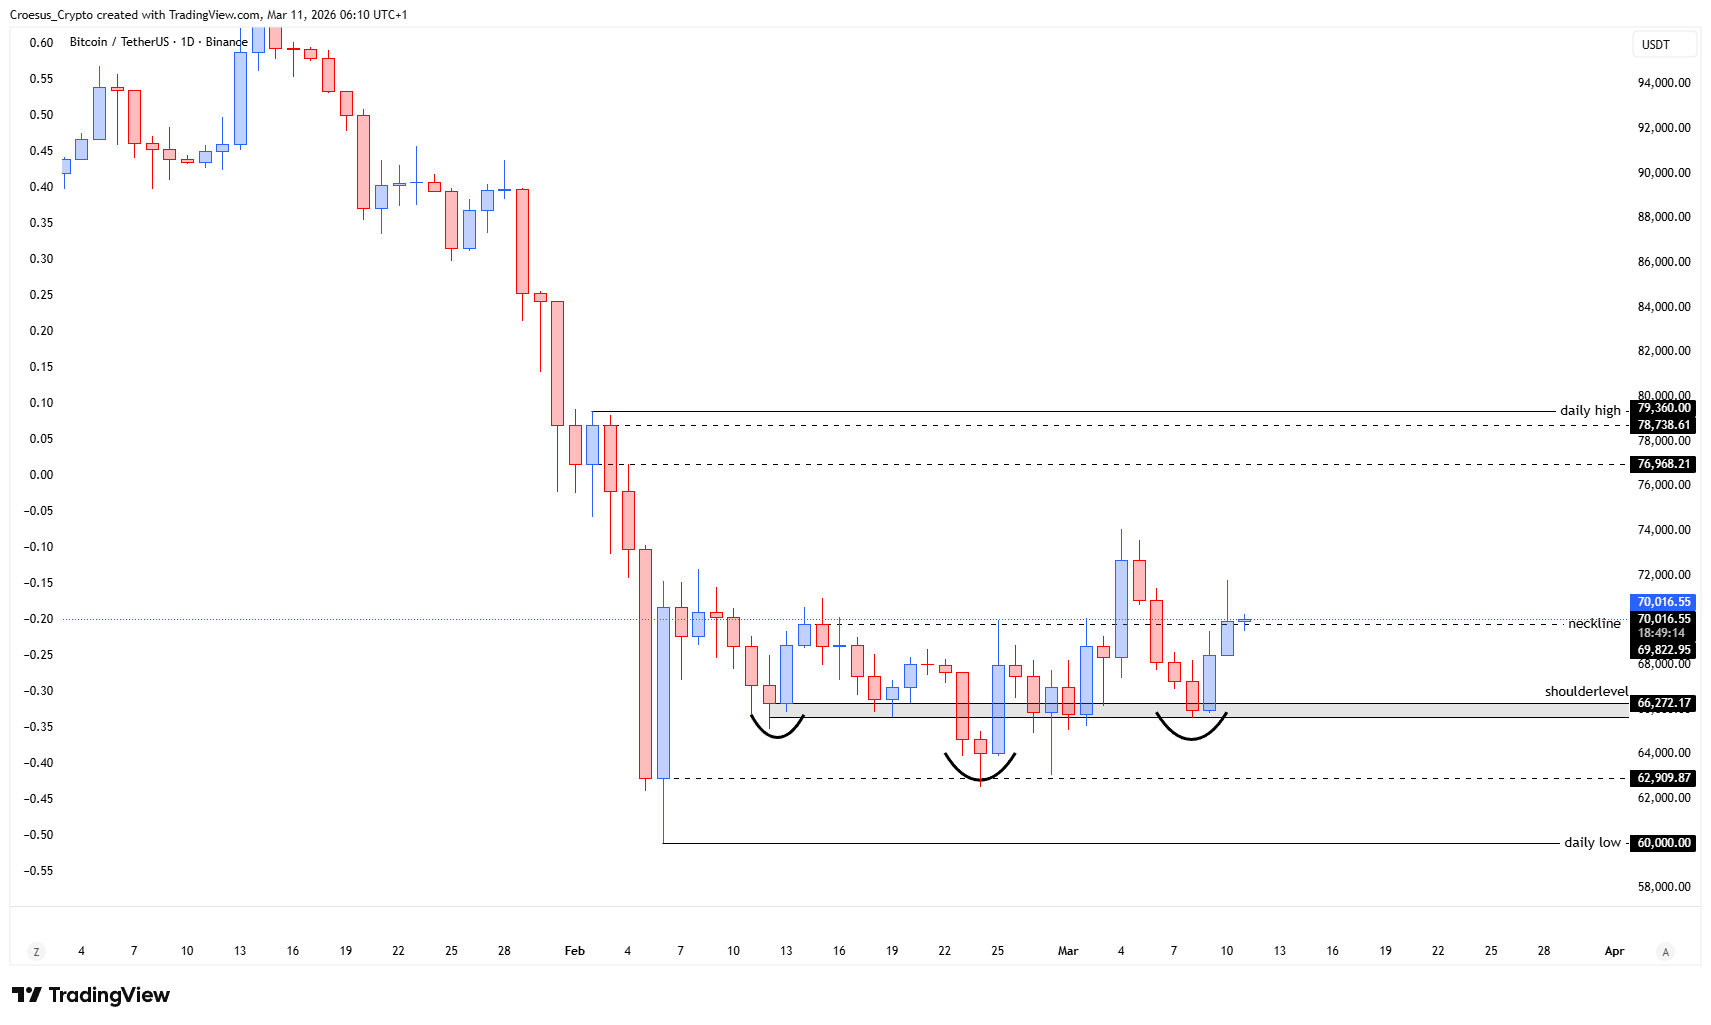
- BTC retested the neckline and closed slightly above the neckline
- The inverse head and shoulders pattern remains valid
Market Structure Analysis
Our BTC daily analysis focuses on whether this neckline acts as reclaimed structure or rolls back into resistance. A successful retest with acceptance typically supports continuation from an inverse head and shoulders, because the neckline becomes a horizontal support after the breakout.
However, the stated bearish trend means this move can still be a corrective leg within a larger bearish market structure, where upside attempts are sold into and any loss of the neckline quickly shifts the structure back to distribution.
Structurally, the close slightly above the neckline is constructive for the pattern, but follow-through is what confirms acceptance: Bitcoin needs to hold above the neckline on subsequent candles and avoid a fast breakdown that would signal a failed reclaim and potential liquidity grab.
Key Levels and Scenarios
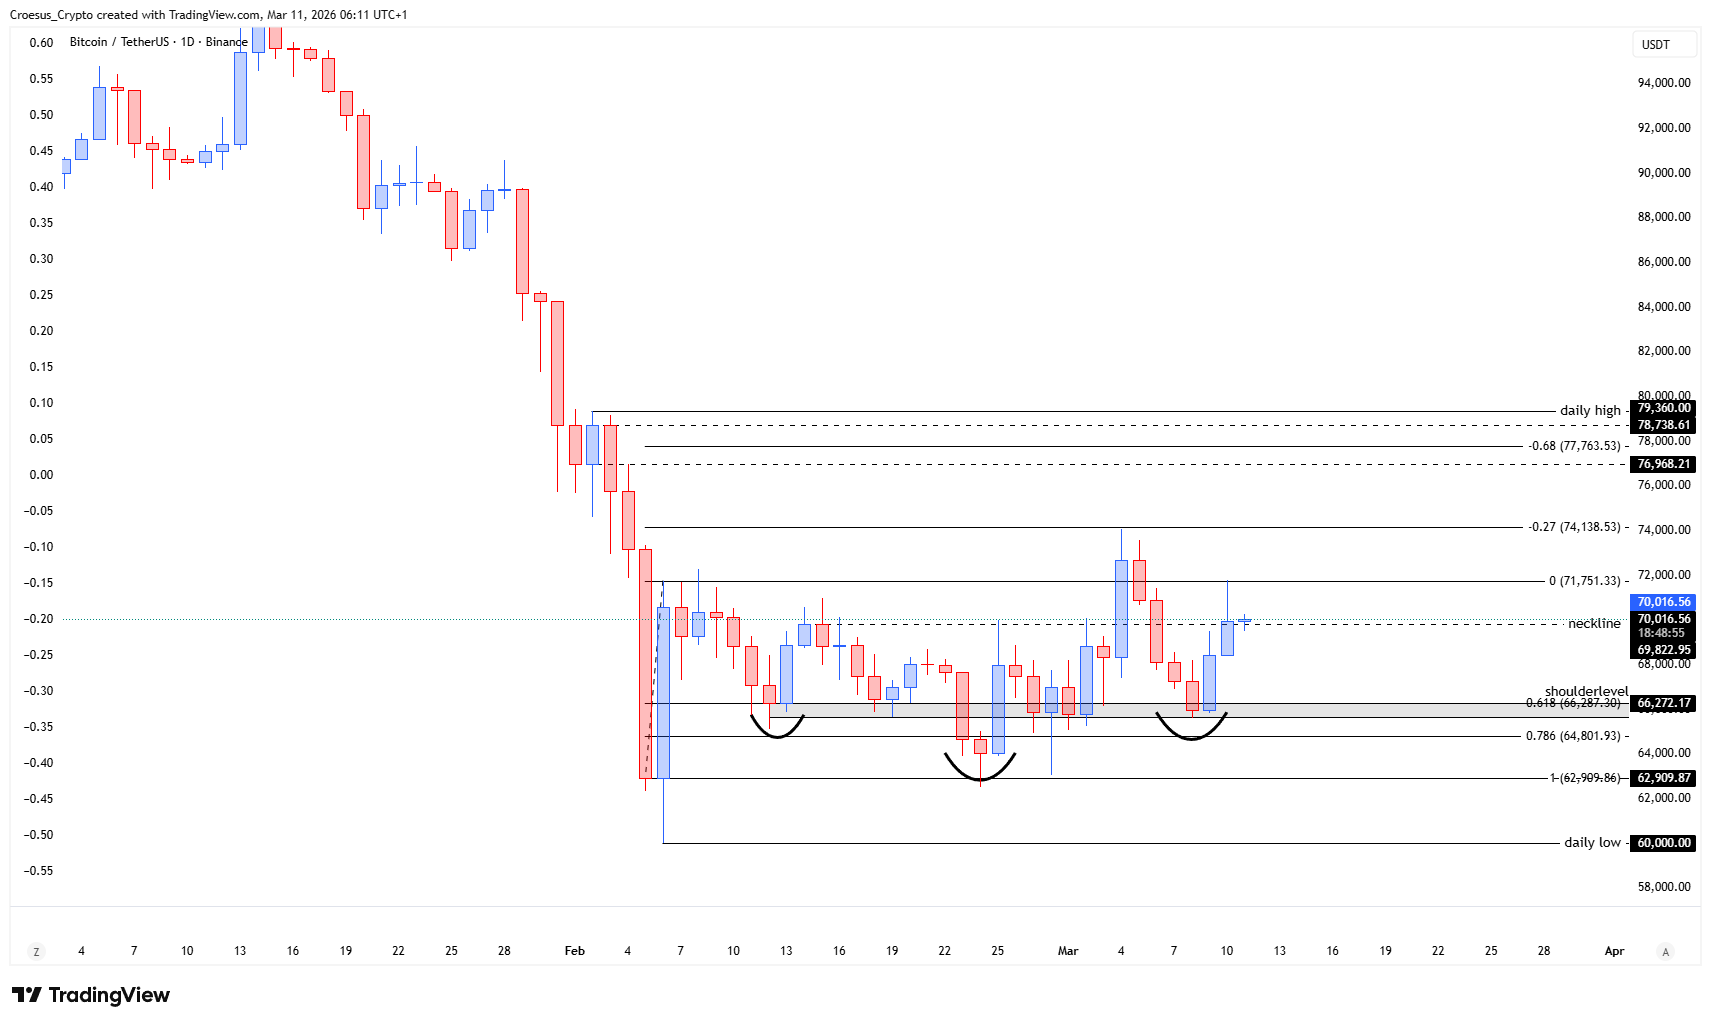
BTC daily analysis scenarios are defined by the neckline reaction. Bullish continuation becomes more likely if price continues to accept above the neckline and holds it on retests. Bearish continuation remains the base case if Bitcoin loses the neckline and trades back below it with momentum, implying the inverse head and shoulders is failing within the broader downtrend.
- Neckline level: primary pivot for support/resistance and pattern validation
- Retest zone around the neckline: acceptance vs rejection area for follow-through
- Right shoulder area: structural support that must hold to keep the pattern intact
- Recent swing low: bearish continuation trigger if broken, signaling renewed downside structure
This analysis is for informational purposes only and does not constitute financial advice.