BTC Marketcap / Bitcoin
BTC daily analysis 12/03/2026. Bitcoin is still trading in a bearish context, but our BTC daily analysis shows price holding an important structural support after a neckline break-and-retest, while pressing into a higher timeframe barrier that could define the next swing.
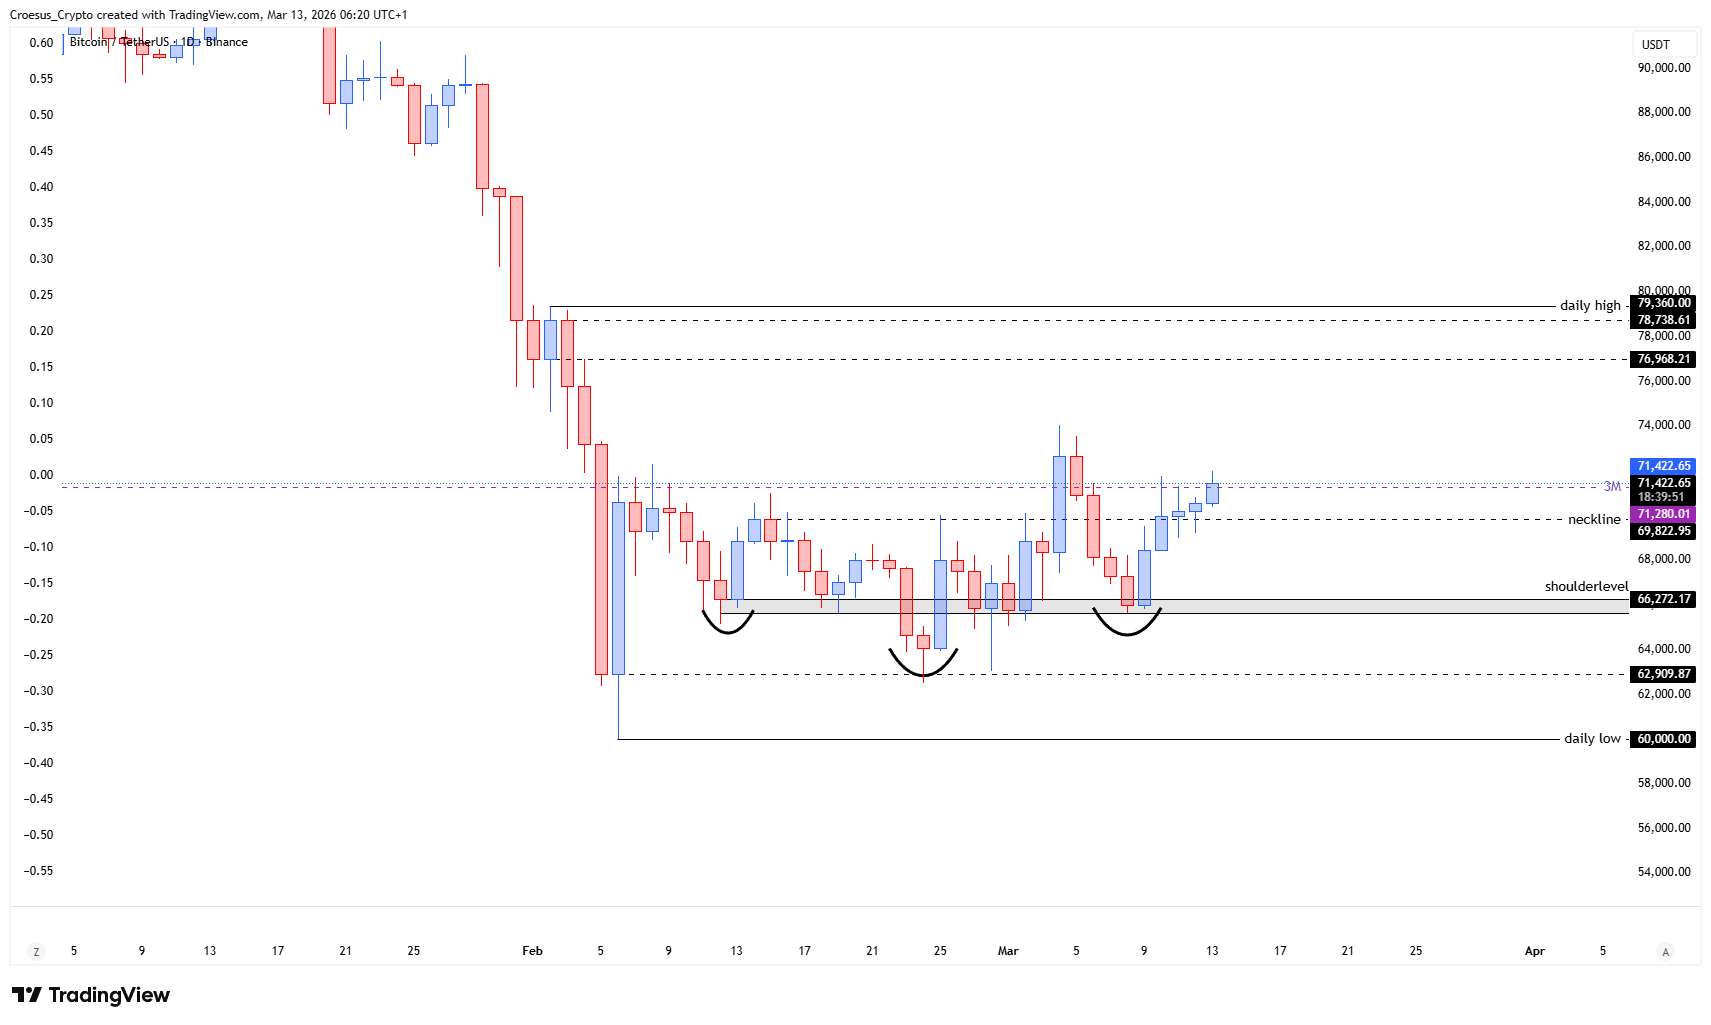
- After the break and retest of the neckline, the price of BTC held ground, confirming the neckline as support for now.
- Eventhough the last candle is one we can't take into account yet, we see at this moment an attempt to attack the 3M level, a stronger higher timeframe level.

Market Structure Analysis
From a market structure perspective, the break and retest of the neckline is the key event: price previously pushed through a major horizontal line, then returned to it and held, which keeps the neckline active as near-term support resistance context for our BTC daily analysis.
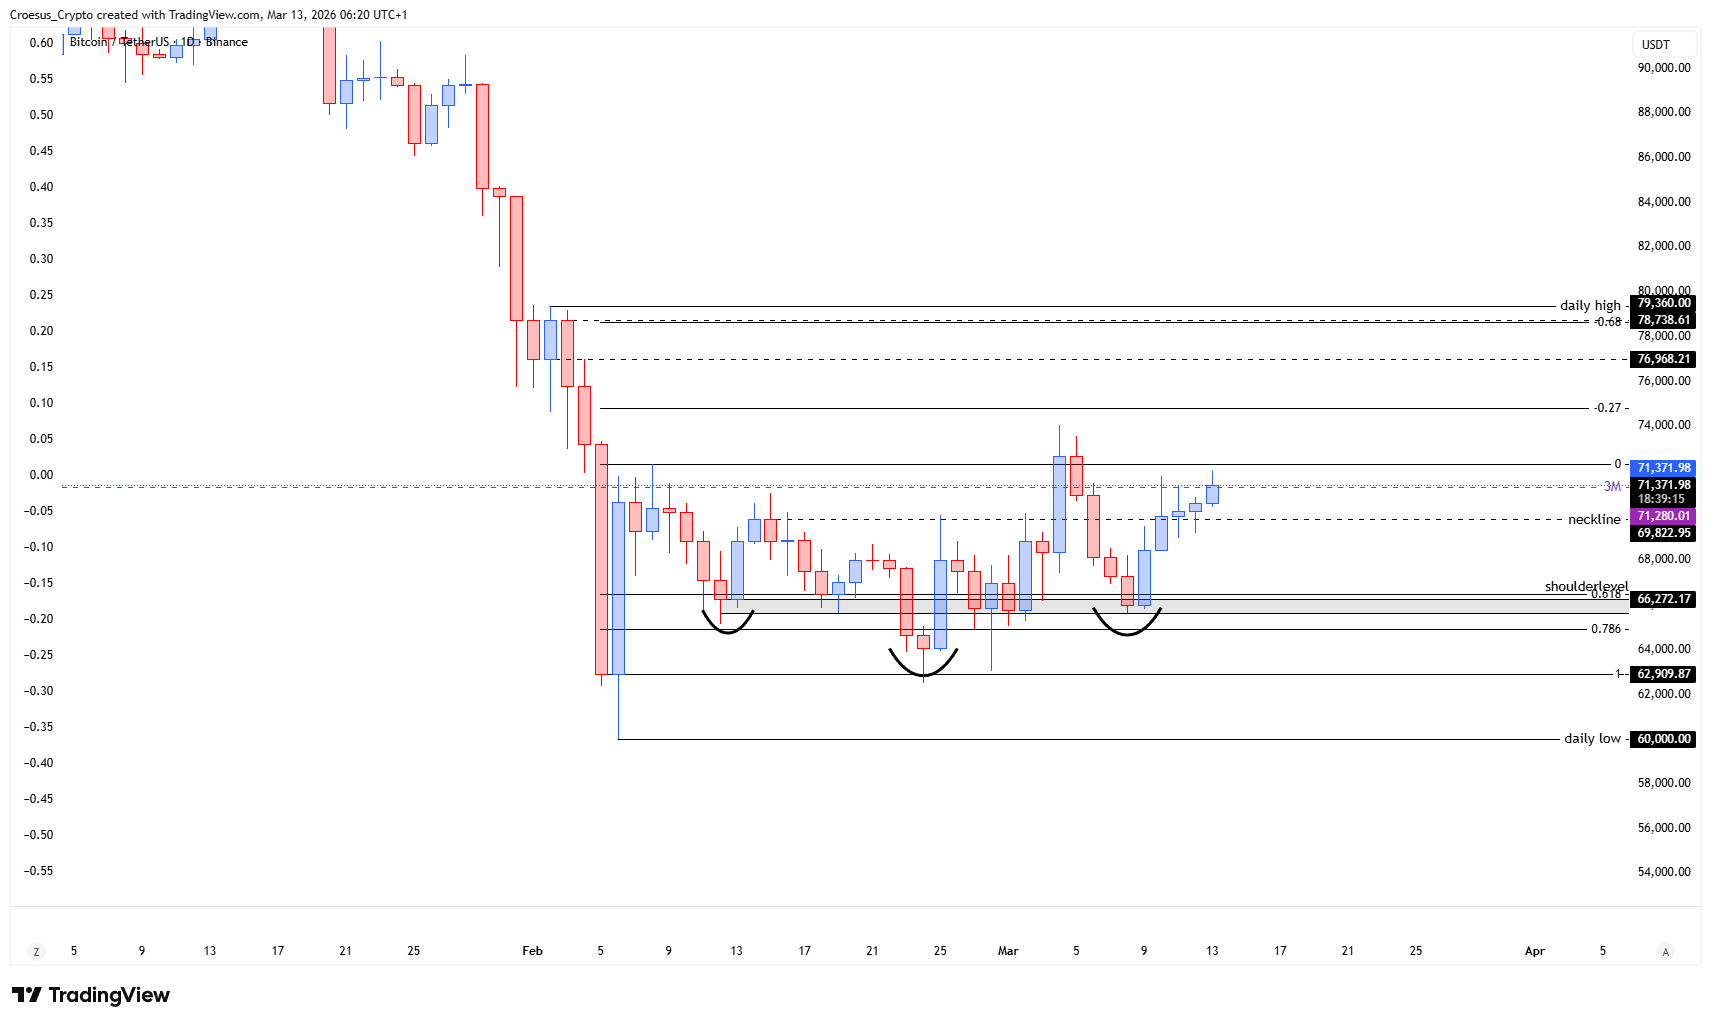
In a bearish trend, this kind of hold often reads as a corrective pause rather than a confirmed reversal unless follow-through builds above surrounding supply. The current attempt to attack the 3M level matters because higher timeframe levels typically attract liquidity and act as decision points; they can cap a corrective rally and trigger continuation to the downside, or, if reclaimed and held, force a larger structural reassessment.

Key Levels and Scenarios
Bearish continuation remains the base case while BTC fails to decisively reclaim the 3M level. A rejection at that higher timeframe barrier keeps the move framed as corrective and increases the odds of a rotation back down into the neckline area. A more constructive scenario requires clean acceptance above the 3M level, with price holding it on a retest—shifting the immediate structure away from pure sell-the-rally conditions.
- Neckline level: current structural support; losing it weakens the rebound thesis
- 3M level: higher timeframe resistance; reclaiming it is required to reduce bearish pressure
- Retest zones around the neckline: key support resistance area for confirmation vs failure
Trading Implications
Given the bearish backdrop, our technical analysis favors patience around the 3M level: aggressive participants typically look for rejection signals, while conservative participants often wait for either a confirmed breakdown back through the neckline or a proven reclaim of the 3M level with acceptance. Risk stays elevated while price sits between these two structural references.
This analysis is for informational purposes only and does not constitute financial advice.