


Our Bitcoin daily analysis for 12 December 2025 focuses on the corrective structure that formed after the sharp selloff into the 80,600 USDT low and the subsequent rotation inside a well-defined range.
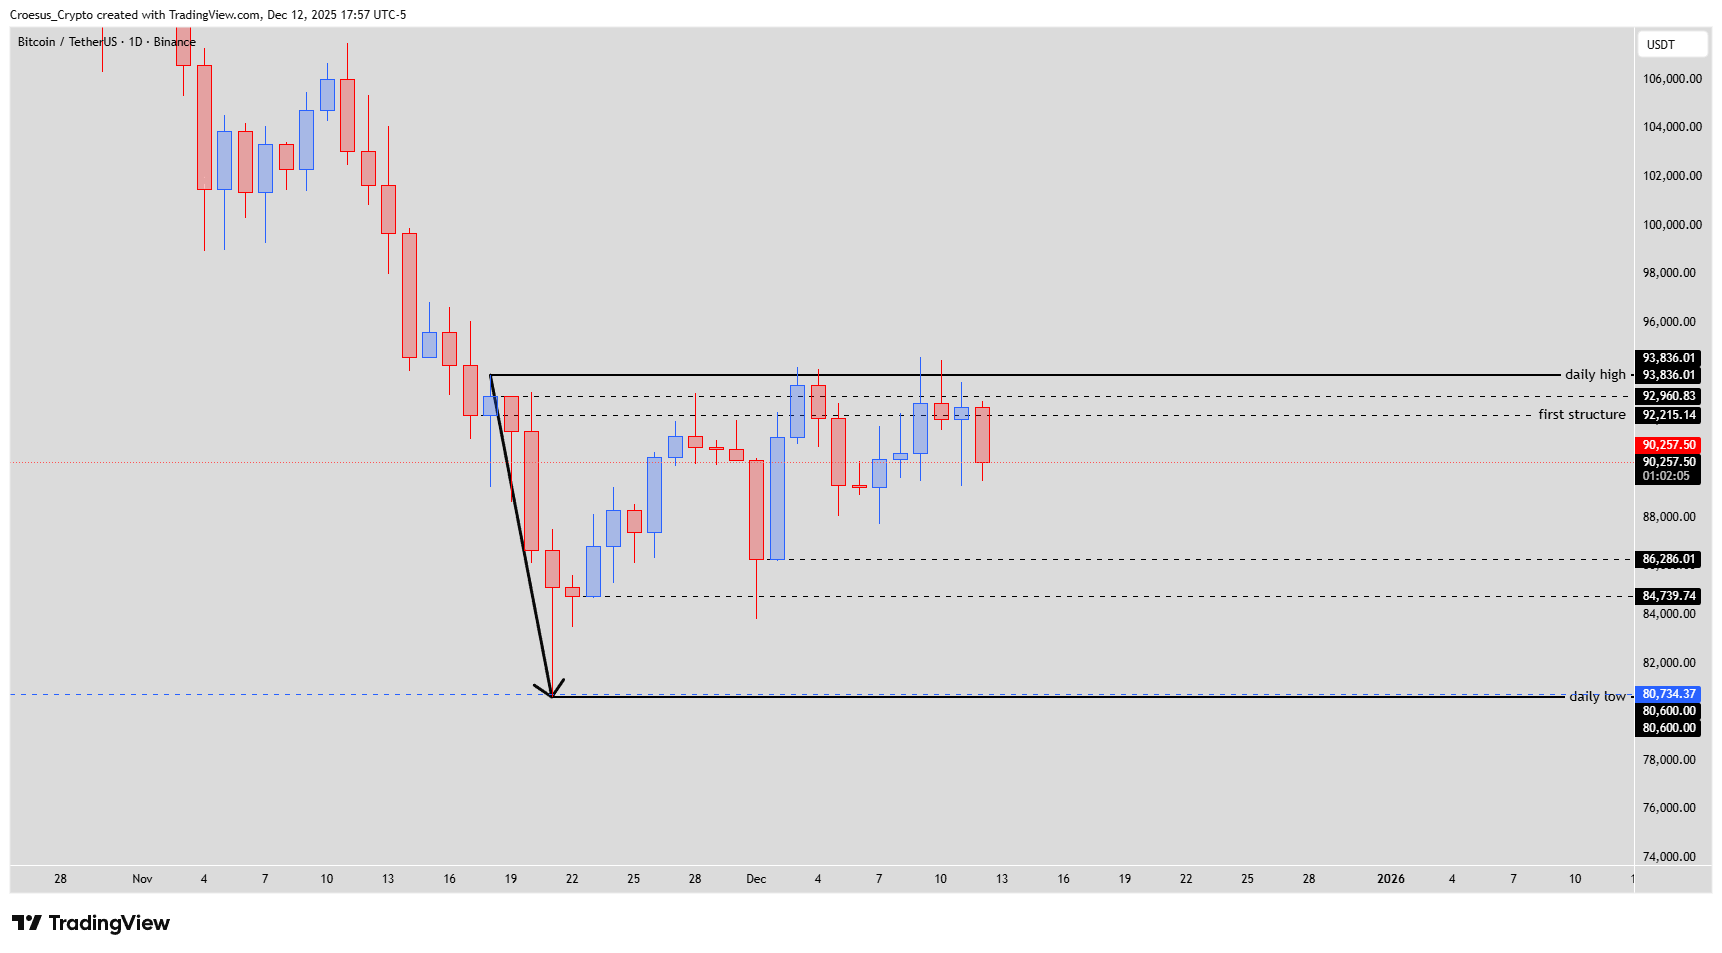
Bitcoin daily chart December 2025 with range between 80,600 daily low and 93,836 daily high and marked support levels.
Technical Analysis Key Points
- BTC printed a sharp impulsive drop into the 80,600 daily low before a strong reaction higher
- Price now trades inside a broad daily range between the 80,600 low and the 93,836 daily high
- “First structure” resistance sits in the 92,215–92,960 zone, capping multiple attempts to break higher
- ntermediate supports are visible around 86,286 and 84,739 within the range
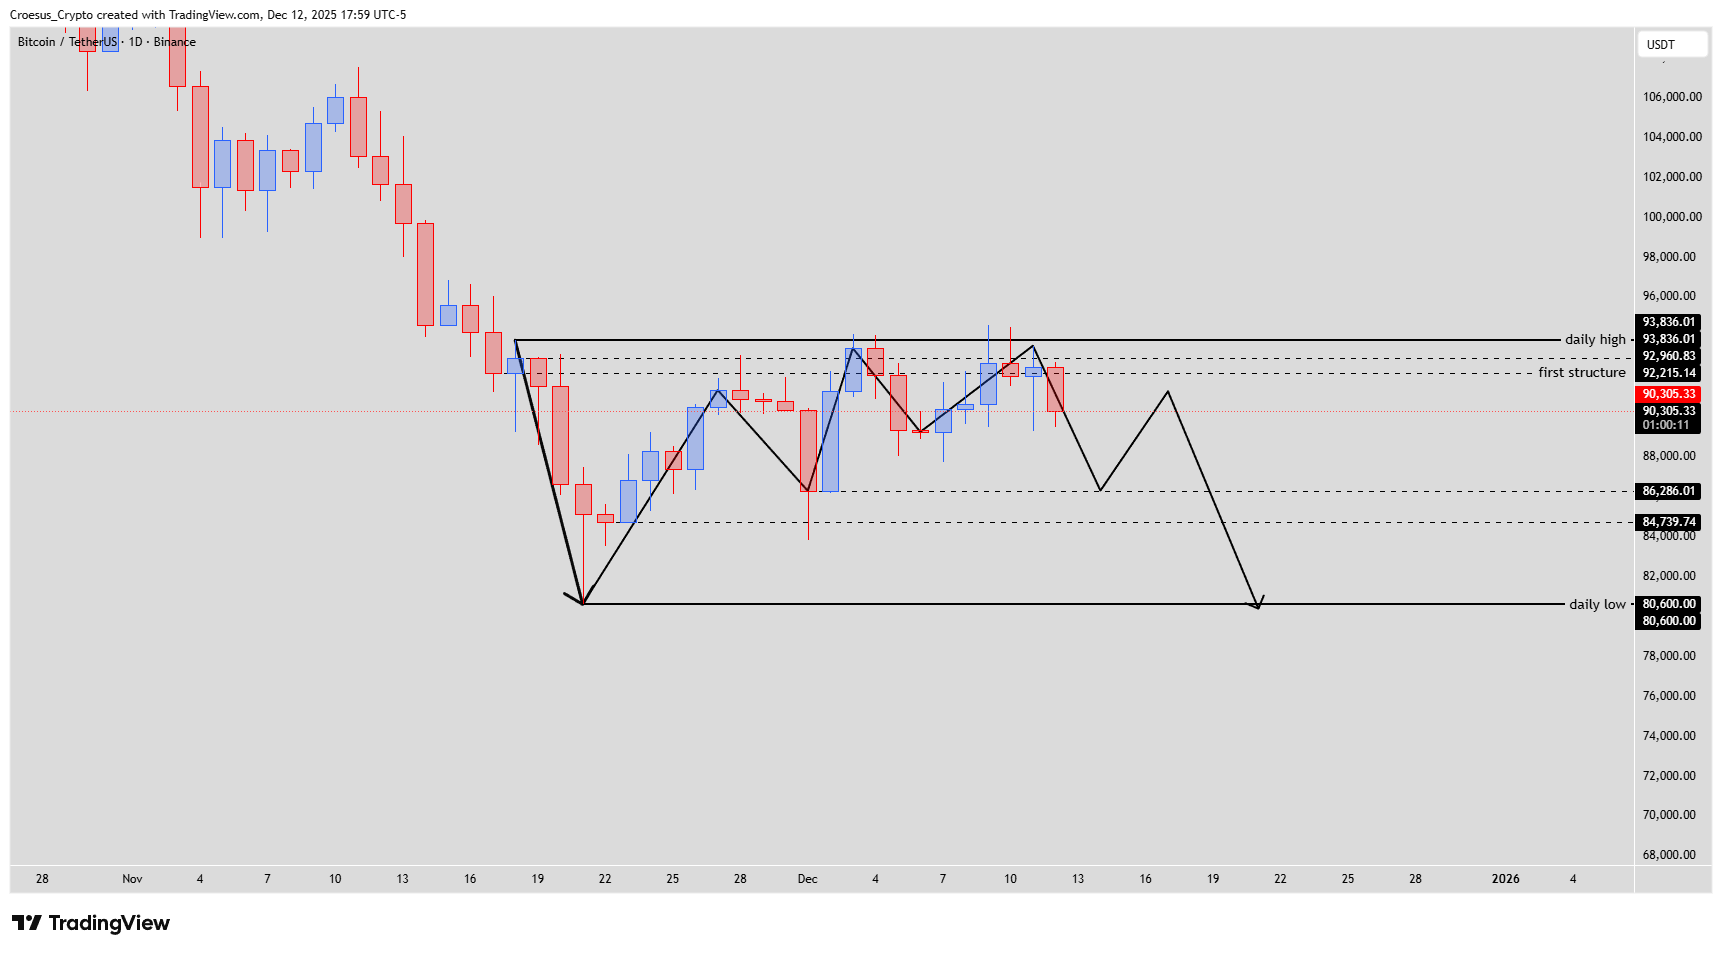
- The short-term structure shows lower highs developing against the 92–93k resistance, keeping downside risk elevated
Market Structure Analysis
From a technical analysis perspective, this Bitcoin daily analysis shows a classic post-impulse corrective range.
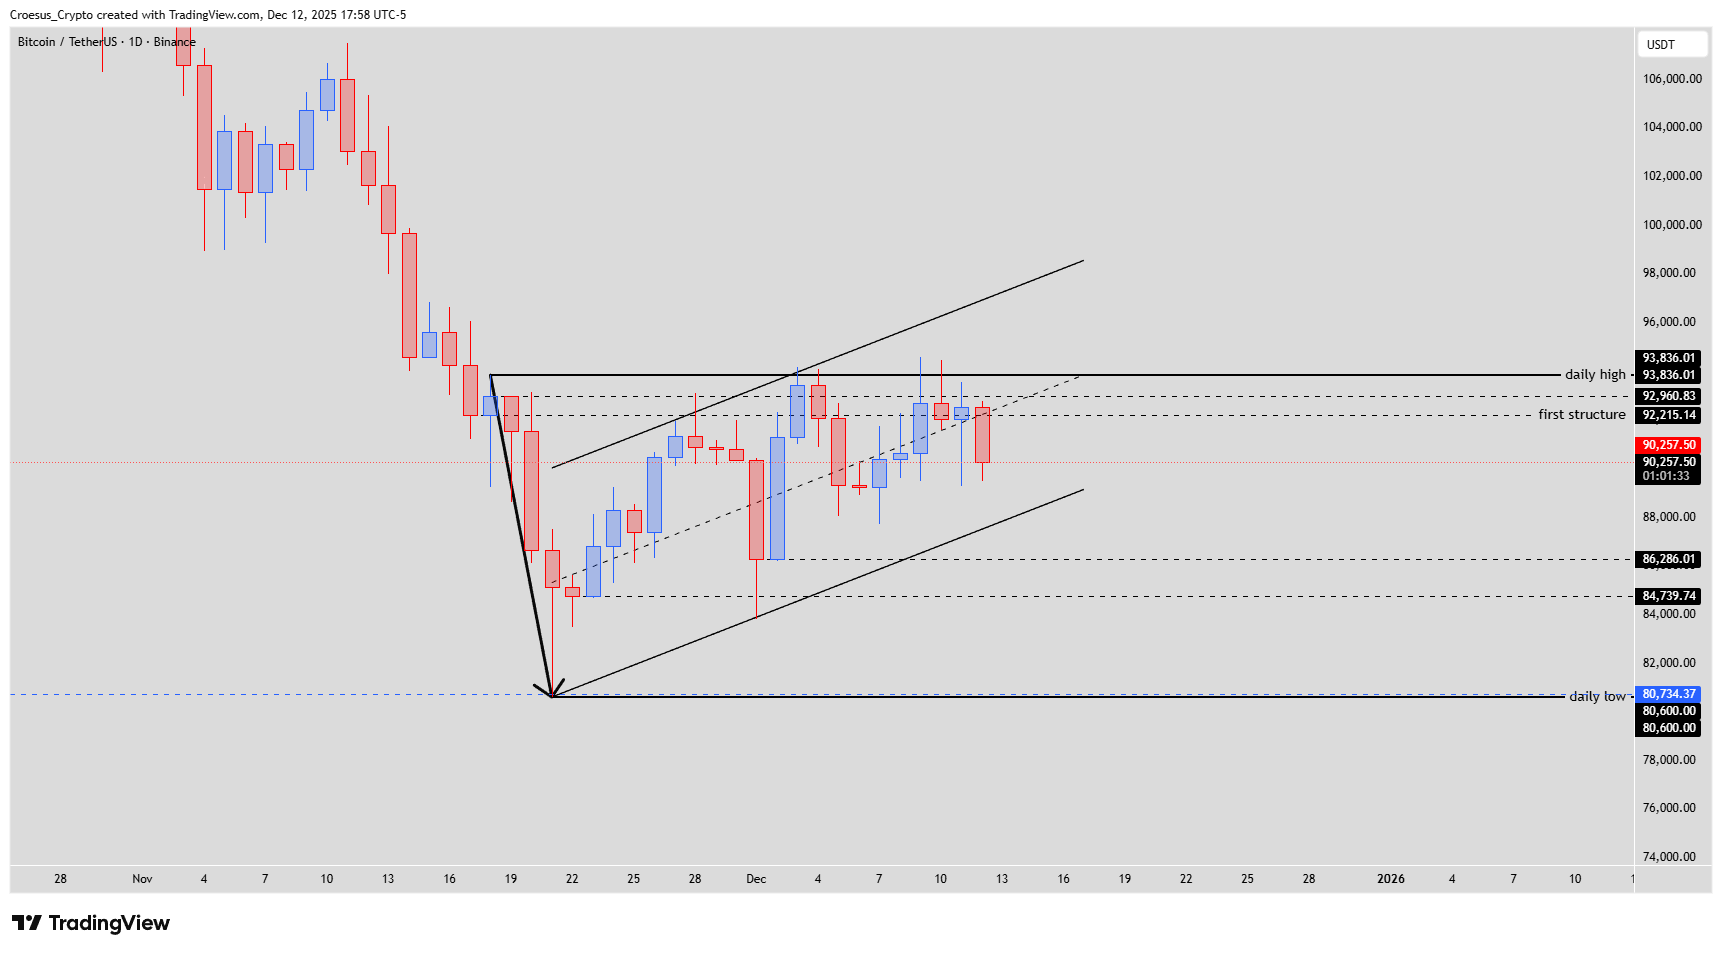
The rising channel from 80,600 into the 92–93k resistance area already broke, and the most recent swing failed below the daily high, confirming seller presence at the top of the box.
Support resistance interaction is clear: buyers defend 86,286 and 84,739 for now, but each bounce is weaker.
A clean Fibonacci confluence is not obvious here, so we prioritise horizontal levels and the evolving lower-high pattern for our bias.
Key Levels and Scenarios
Bullish scenario: Bulls need a daily close back above the 92,215–92,960 first structure and ultimately through 93,836 to invalidate the current lower-high sequence and open room for a larger squeeze higher.
Key levels to watch:
93,836 – Daily high and range top; break and hold flips structure short-term bullish
92,215–92,960 – First structure resistance; primary rejection zone for sellers
86,286 – First intrarange support; loss exposes deeper rotation
84,739 – Secondary support; failure invites a full retest of range lows
80,600 – Daily low; breakdown would confirm continuation of the broader downtrend
Trading Implications
For this Bitcoin daily analysis, we see better risk/reward on short setups near 92,215–92,960 and 93,836, with invalidation just above the daily high and initial targets back towards 86,286 and 84,739.
For longs, patient bids closer to 84,739 or even 80,600 offer clearer invalidation and asymmetric upside back into mid-range if the supports hold.
Position sizing should stay moderate inside the range and increase only on a confirmed daily close outside 80,600 or 93,836, as volatility is likely to expand on any breakout.
This is not financial advice; always do your own research and manage your risk appropriately.