


BTC Marketcap / Bitcoin
In this BTC daily analysis for 12 February 2026, we see Bitcoin replicating the broader market behaviour: a sharp selloff followed by a slowing bearish correction. Our technical analysis focuses on structure, liquidity zones and clear support resistance bands rather than indicators, to map the evolving ABC corrective pattern on BTC.
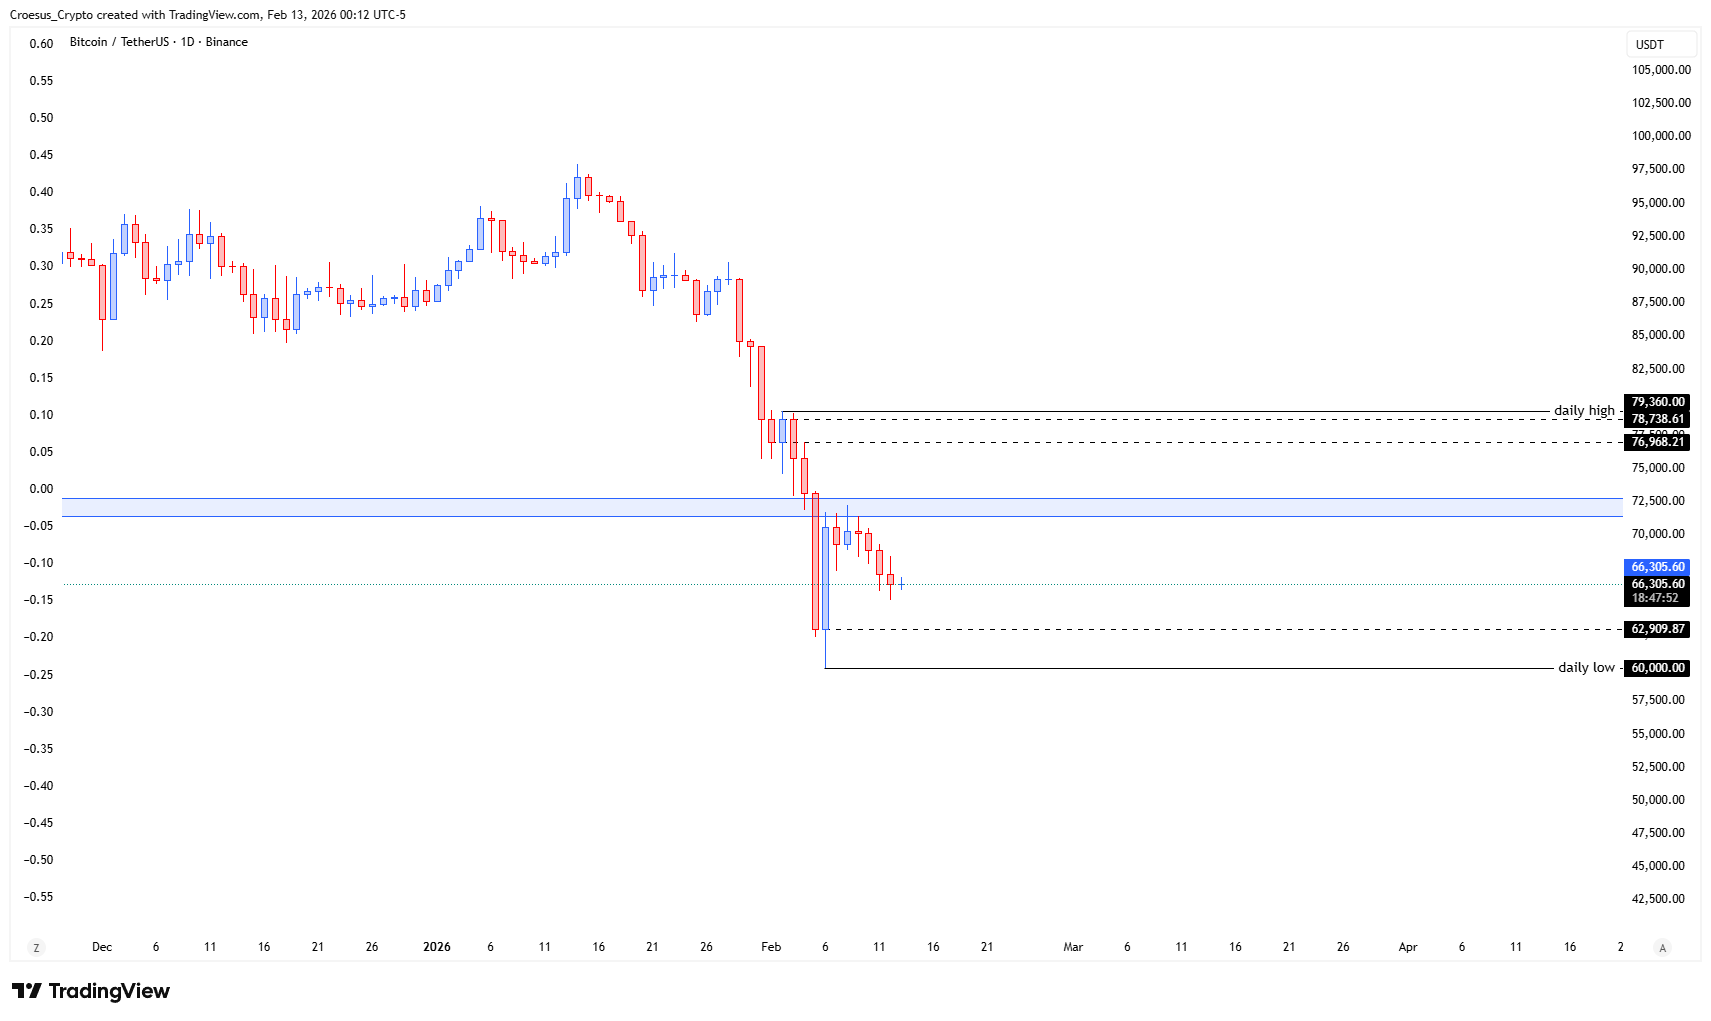
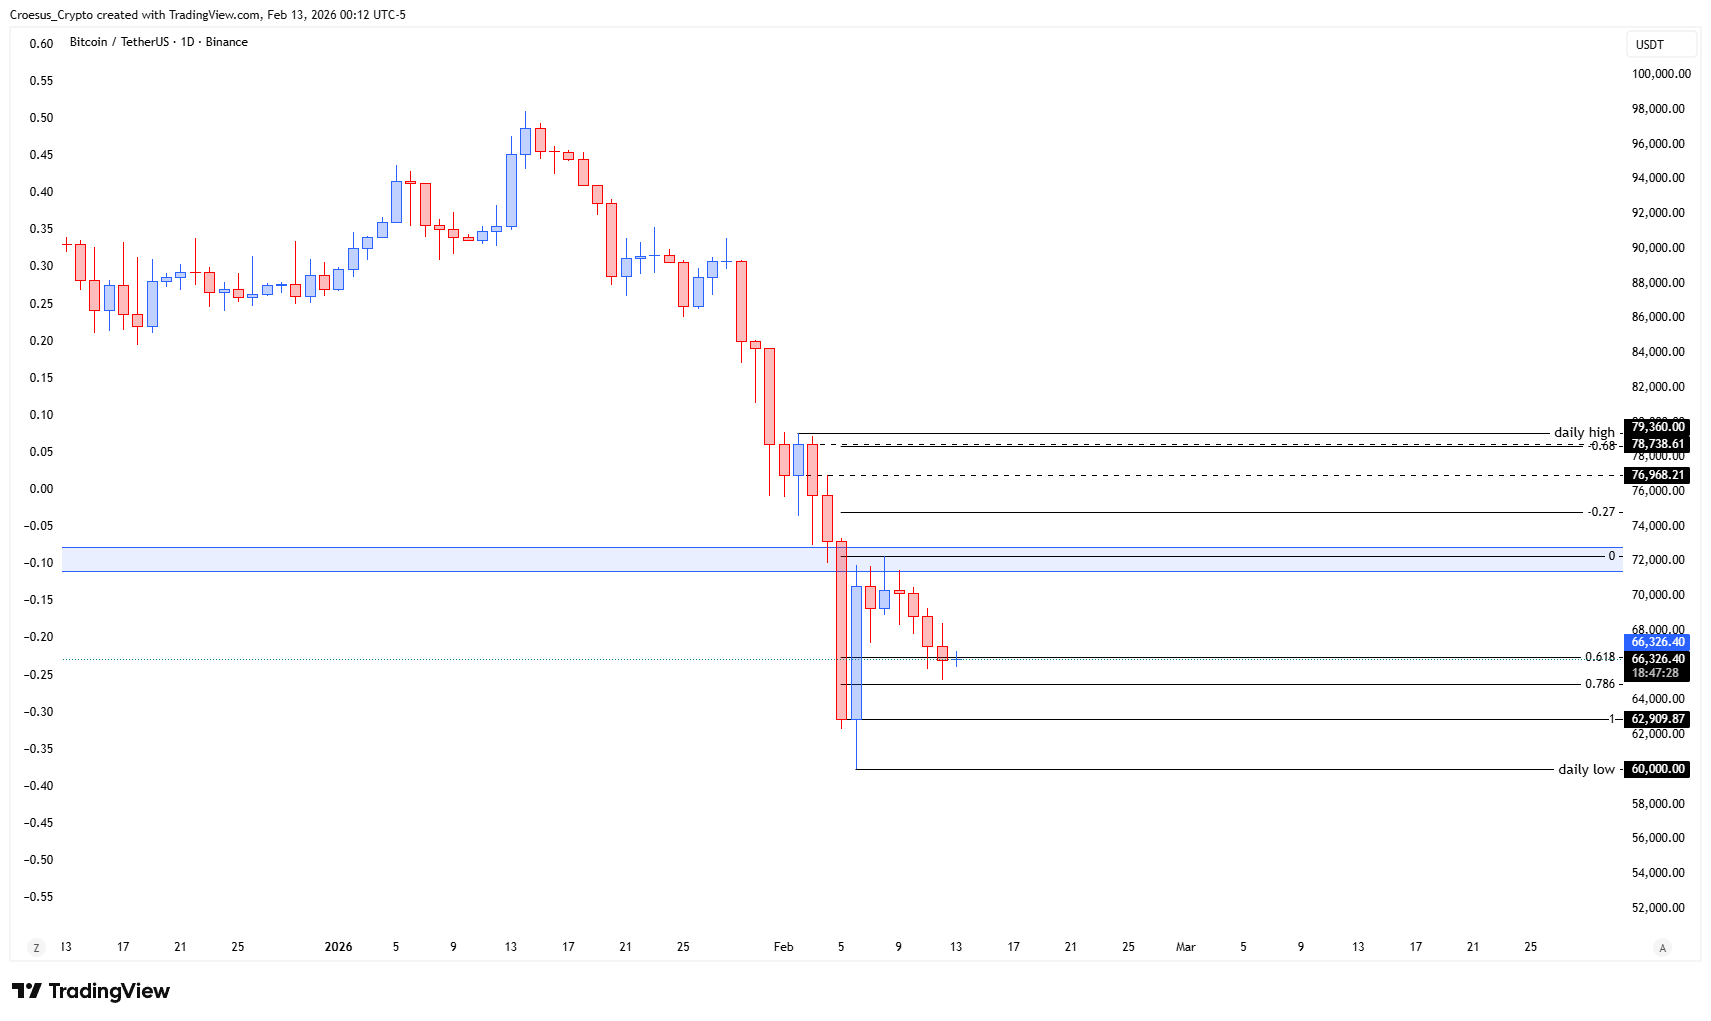
- same slowing down of the bearish move as with TOTAL
- This could potentially also be the printing of the B-leg within a larger ABC-correction.
- Same warning : this is still a countertrend move within a broader bearish market
Market Structure Analysis
Price sold off impulsively from the 79k “daily high” area and found a strong reaction just above the 60k daily low. Since then BTC has been grinding lower in a slower, overlapping fashion, signalling corrective behaviour consistent with a developing B-leg of an ABC structure. Candles are smaller, wicks increase and momentum fades, which often precedes a countertrend squeeze. The 62k–63k zone acts as immediate support, while a Fibonacci retracement cluster around 66k–68k marks the first overhead resistance. Above that, 72k is the main mid-range cap, with a heavy supply band stacked between 76k and 79k where previous buyers are likely trapped. As long as BTC trades below this upper band, the higher timeframe remains bearish even if a bounce unfolds.
Key Levels and Scenarios
Bullish scenario in this BTC daily analysis: a squeeze from current prices into the 66k–68k Fibonacci area and potentially 72k, still treated as a corrective B-leg within the dominant downtrend.
Critical levels to watch:
- $60,000 – Daily low and key downside invalidation; a break suggests the C-leg extension lower is underway.
- $62,900 area – Short-term support; holding keeps the corrective structure intact.
- $66,000–68,000 – First major resistance and Fibonacci confluence, ideal zone for profit-taking on countertrend longs.
- $72,000 – Mid-range resistance; failure here reinforces the bearish structure.
Trading Implications
Given this remains a countertrend move within a broader bearish market, we see better conditions for tactical, smaller-sized longs with tight invalidation below 60k and a preference for fading strength into resistance rather than aggressively chasing upside.
This analysis is for informational purposes only and does not constitute financial advice.