


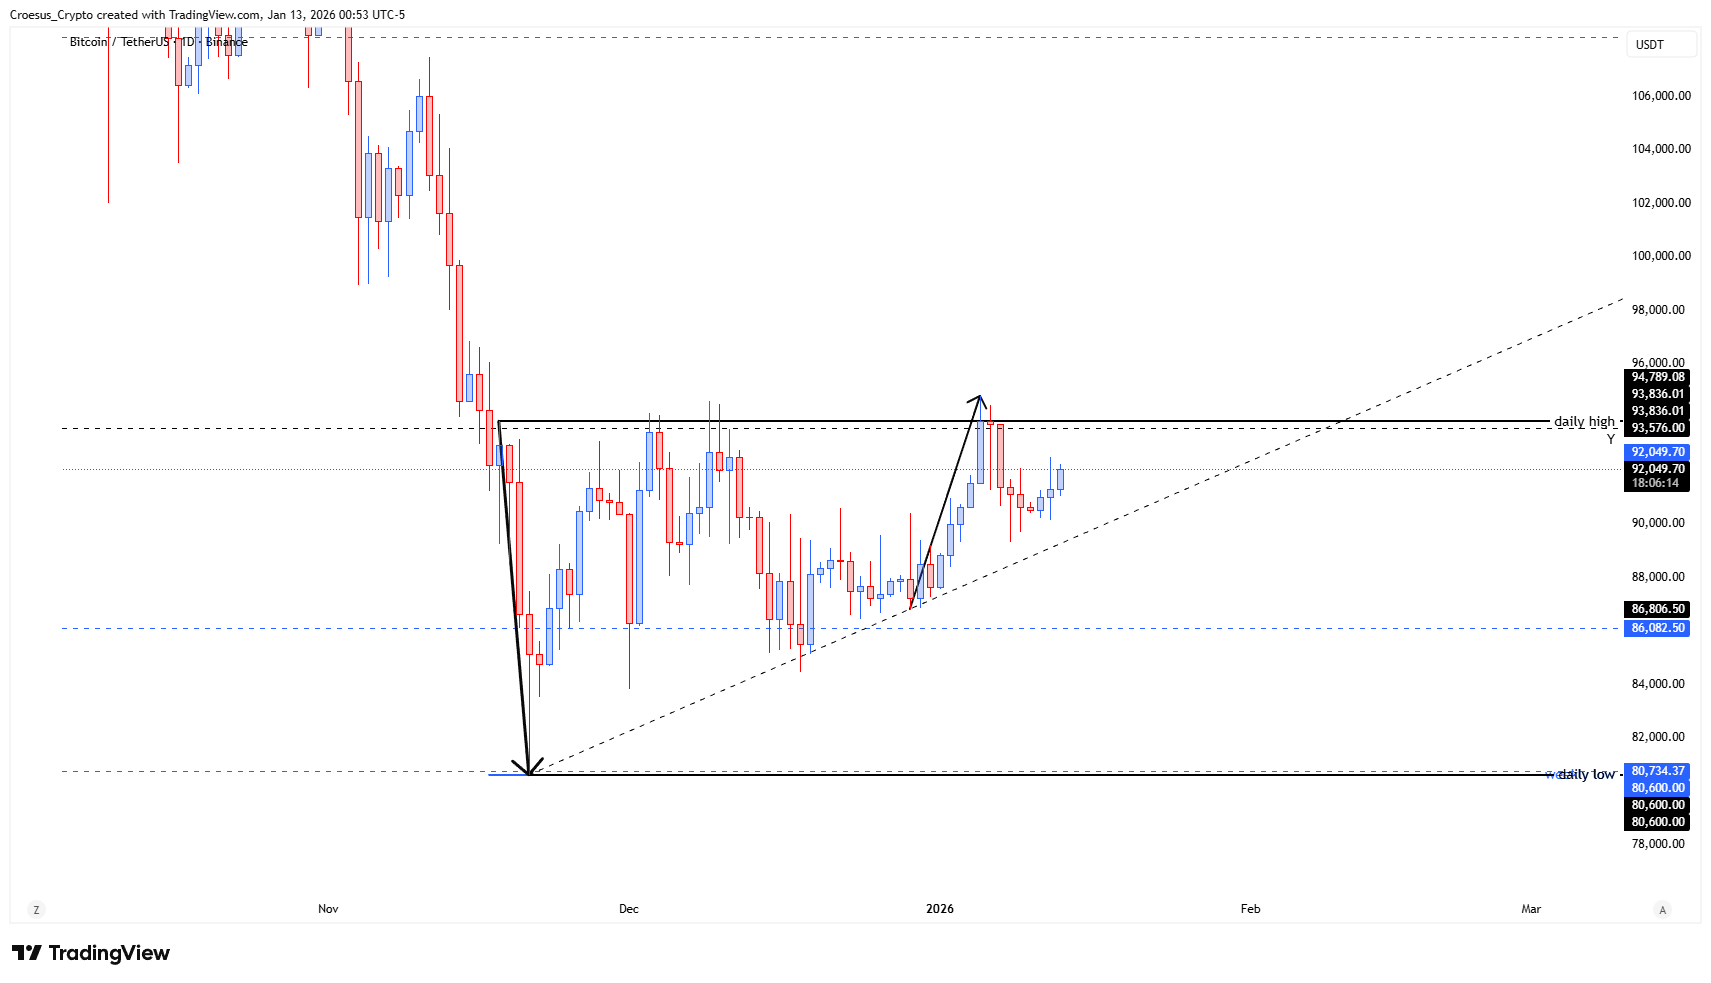
Our BTC daily analysis for 12 January 2026 focuses on a prolonged consolidation after a strong bearish impulse. For 52 days, price has been locked in a well-defined daily range, with a rising trendline supporting price from the December low and resistance sitting near the daily high around the low-90Ks. This technical analysis zooms in on that range and the recent small fakeout above resistance.
BTC daily chart 12 January 2026 with 52-day range, prior bearish impulse, rising trendline, and minor fakeout near daily high
Technical Analysis Key Points
- just as with the TOTAL we can see a bearish impulse defining the daily range in which the index is stuck for 52 days.
- During week 1 of January we saw a bullish impulse towards the daily high, breaking it ever so slightly creating a miniscule fakeout, just as we could see with the TOTAL chart.
- same scenarios here : bullish when we break above the Yearly level, just below the daily high. Bearish when we get rejected again at the daily high, creating a double top and breaking the upward trendline
Market Structure Analysis
Structurally, BTC remains in a corrective state on the daily timeframe. The strong downside move into late November defined the current support resistance range between the daily low around 80K and the daily high just under 95K. Since then, price has oscillated inside this box, building liquidity both above the highs and below the lows.
During the first week of January, buyers pushed BTC along the ascending trendline into the range high, briefly breaking the daily high and printing a small fakeout before closing back inside the range. This mirrors the behaviour seen on the TOTAL chart and reinforces the daily high as a key resistance zone. As long as we stay inside this structure, we treat moves into the extremes as potential liquidity grabs rather than confirmed breakouts.
Key Levels and Scenarios
Bullish scenario: BTC needs a clean breakout above the yearly level (just below the daily high) and then a successful retest holding that zone as support. That would confirm a shift from range to impulsive upside and open the way toward the mid- to high-90Ks, turning the current fakeout into a genuine breakout in our BTC daily analysis.
Critical levels to watch:
~94–95K daily high: Range resistance and fakeout zone; closing above confirms strength.
Yearly level just below daily high: Break and retest needed for a sustained bullish trend.
~86–87K mid-range support: Intraday pivot; losing it weakens the bullish structure.
Rising daily trendline from December low: Break below signals potential trend reversal.
~80K daily low: Major support; a break would confirm bearish continuation.
If BTC is rejected again at the daily high, a double-top pattern combined with a break of the upward trendline would favour the bearish scenario, opening room for a deeper move back toward 80K as part of a broader corrective phase in this BTC daily analysis.
Trading Implications
Until BTC either reclaims the yearly level or breaks the trendline and daily low, we treat this as a range-trading environment with reduced conviction, favouring well-defined setups around extremes and disciplined risk management rather than aggressive trend positioning.
This is not financial advice; always do your own research and manage your risk appropriately.