


In this Bitcoin daily analysis for 13 January 2026, we see BTC breaking out bullish after a prolonged range-bound phase near the recent lows. This first push above the capped daily high signals a clear change in momentum, but not yet a full trend reversal. Our technical analysis focuses on how price reacts around the broken resistance, the prior range, and nearby Fibonacci retracement zones to determine whether this is the start of a new leg higher or just another liquidity-driven fakeout.
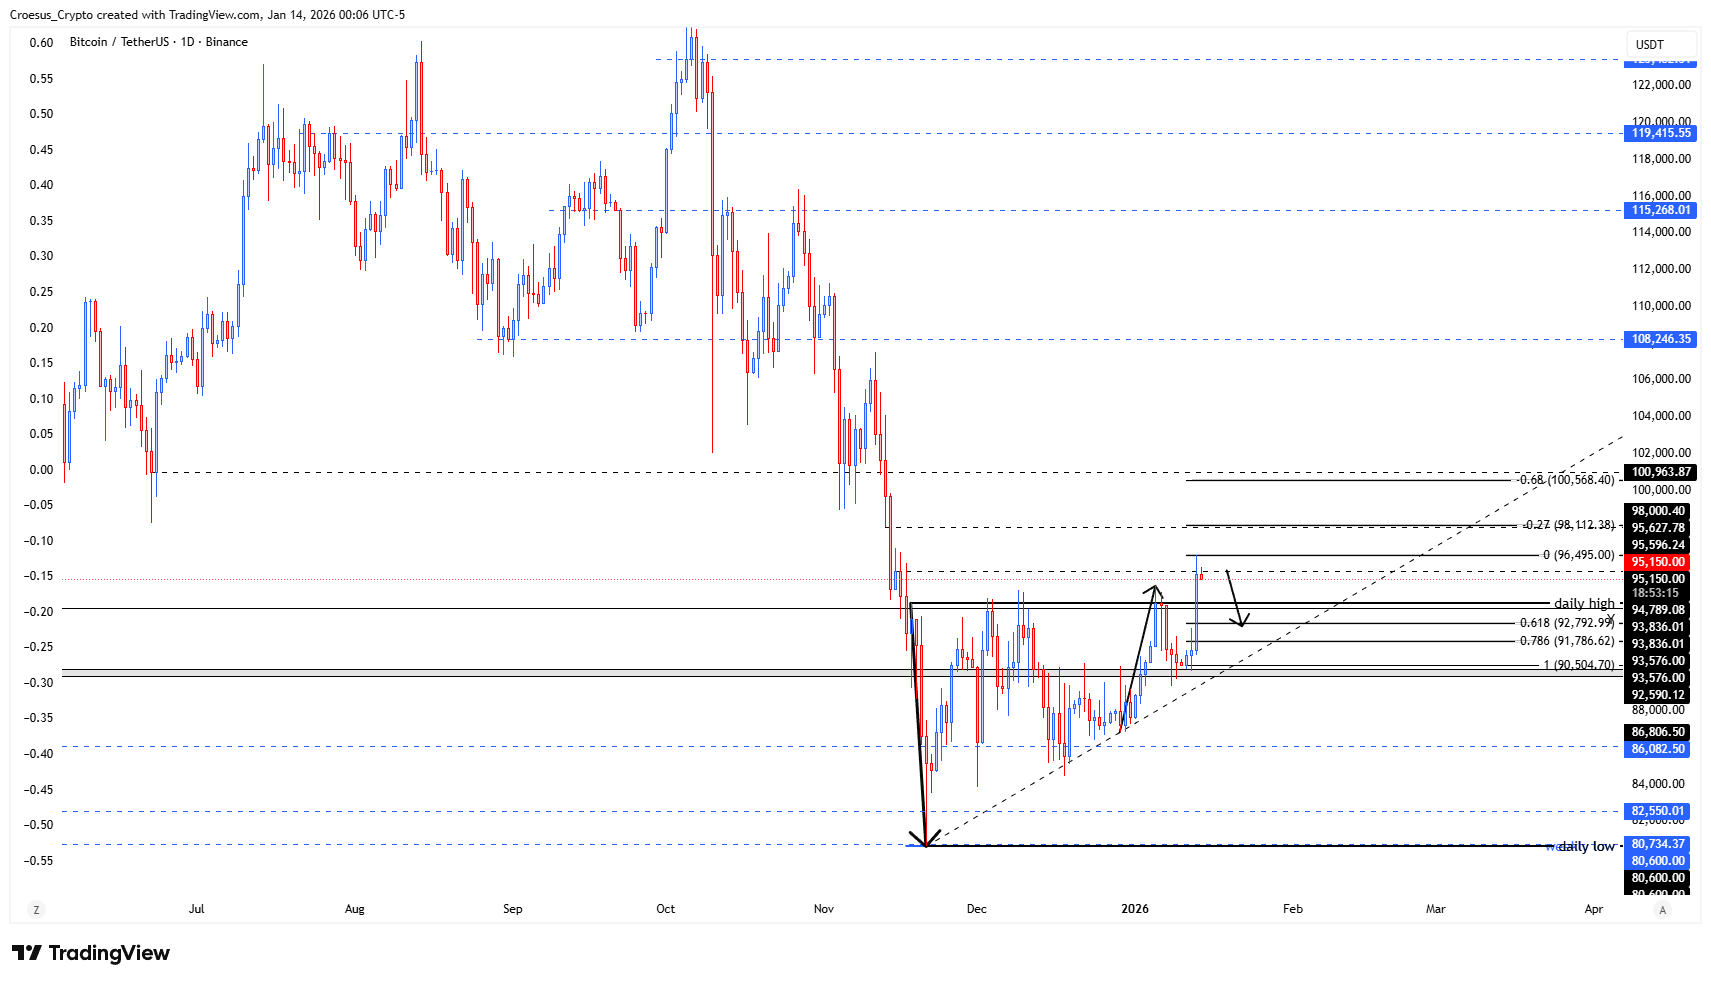
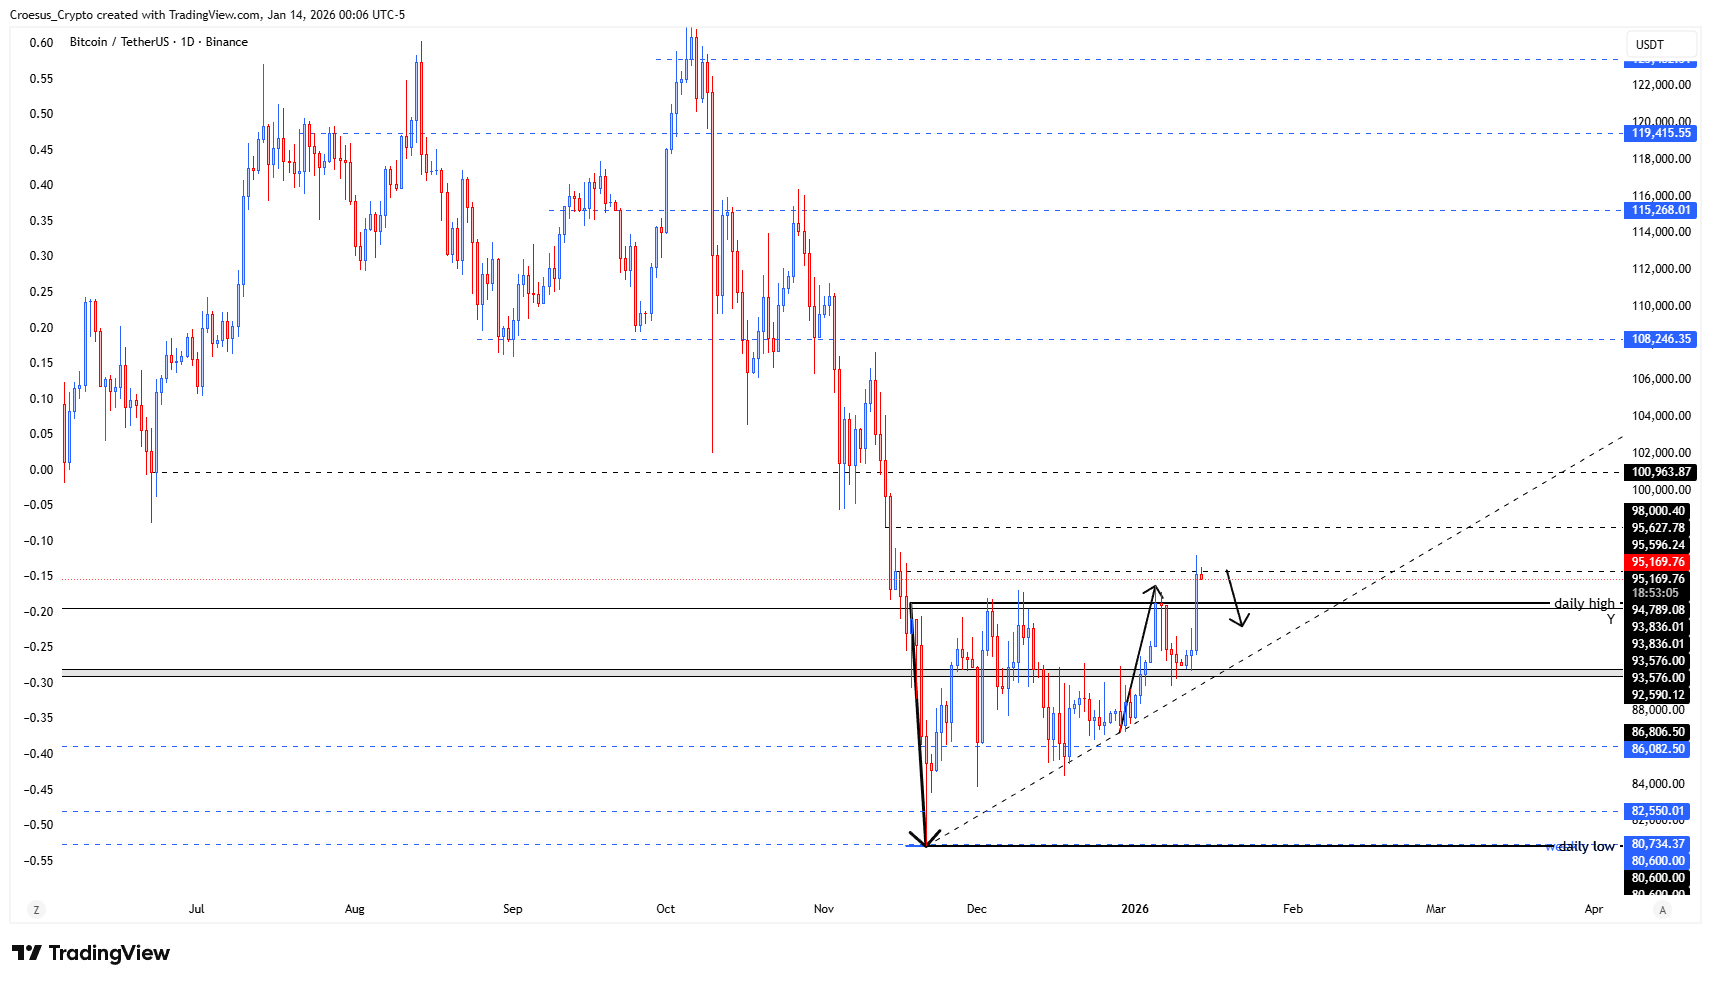
Bitcoin BTC daily chart 13 January 2026 showing bullish breakout from multi-week range with key support resistance levels marked.
Technical Analysis Key Points
- Same as with the TOTAL, after a long range bound movement, we saw the price break out bullish
- This is a first break of structure, a switch of moment. But still not a switch of trend. Therefore we need a second higher high.
- If we see the price confirming the breakout and retesting the broken daily high, our conviction becomes more bullish. But the last candle was a high liquidity candle, pushing price higher very impulsive. Therefore we watch if the price doesn't correct within the range and retests the $93.576 level again. This would mean that we should see possibly a second fake out.
Market Structure Analysis
Structurally, BTC has printed a sharp V-shaped recovery from the recent lows near the 80k area, then consolidated in a sideways range. The latest breakout above the former daily high represents the first break of structure to the upside, hinting at a momentum shift. However, the last daily candle is a strong, impulsive high-liquidity move, which often leaves late buyers vulnerable if price snaps back into the range. A clean retest of the broken daily high holding as support would support a bullish continuation narrative; a failed retest and move back below that level would increase the probability of a second fakeout and a deeper test of the range body and lower Fibonacci supports.
Key Levels and Scenarios
Bullish scenario: if BTC confirms the breakout by consolidating or bouncing above the broken daily high and nearby support resistance flip, we look for continuation toward the 96k–100k resistance cluster, where multiple Fibonacci extension levels align, offering several percent upside from current prices.
Key levels to watch:
Broken daily high area (~mid-95k): key breakout zone; needs to flip to support for sustained upside.
$93.576 level: prior range resistance and key support; a retest from above will decide fakeout vs continuation.
92k–90k zone: dense Fibonacci retracement cluster and structural support if the correction deepens.
86k region: broader range support and last strong demand before the December low.
80.7k daily low: major downside invalidation of the current bullish structure.
Trading Implications
From a trading perspective, we treat this as a momentum shift but not a confirmed trend reversal, avoid buying the initial breakout, and instead wait for either a constructive retest of the broken daily high or a deeper pullback into support where risk/reward and invalidation levels are clearly defined.
This is not financial advice; always do your own research and manage your risk appropriately.