


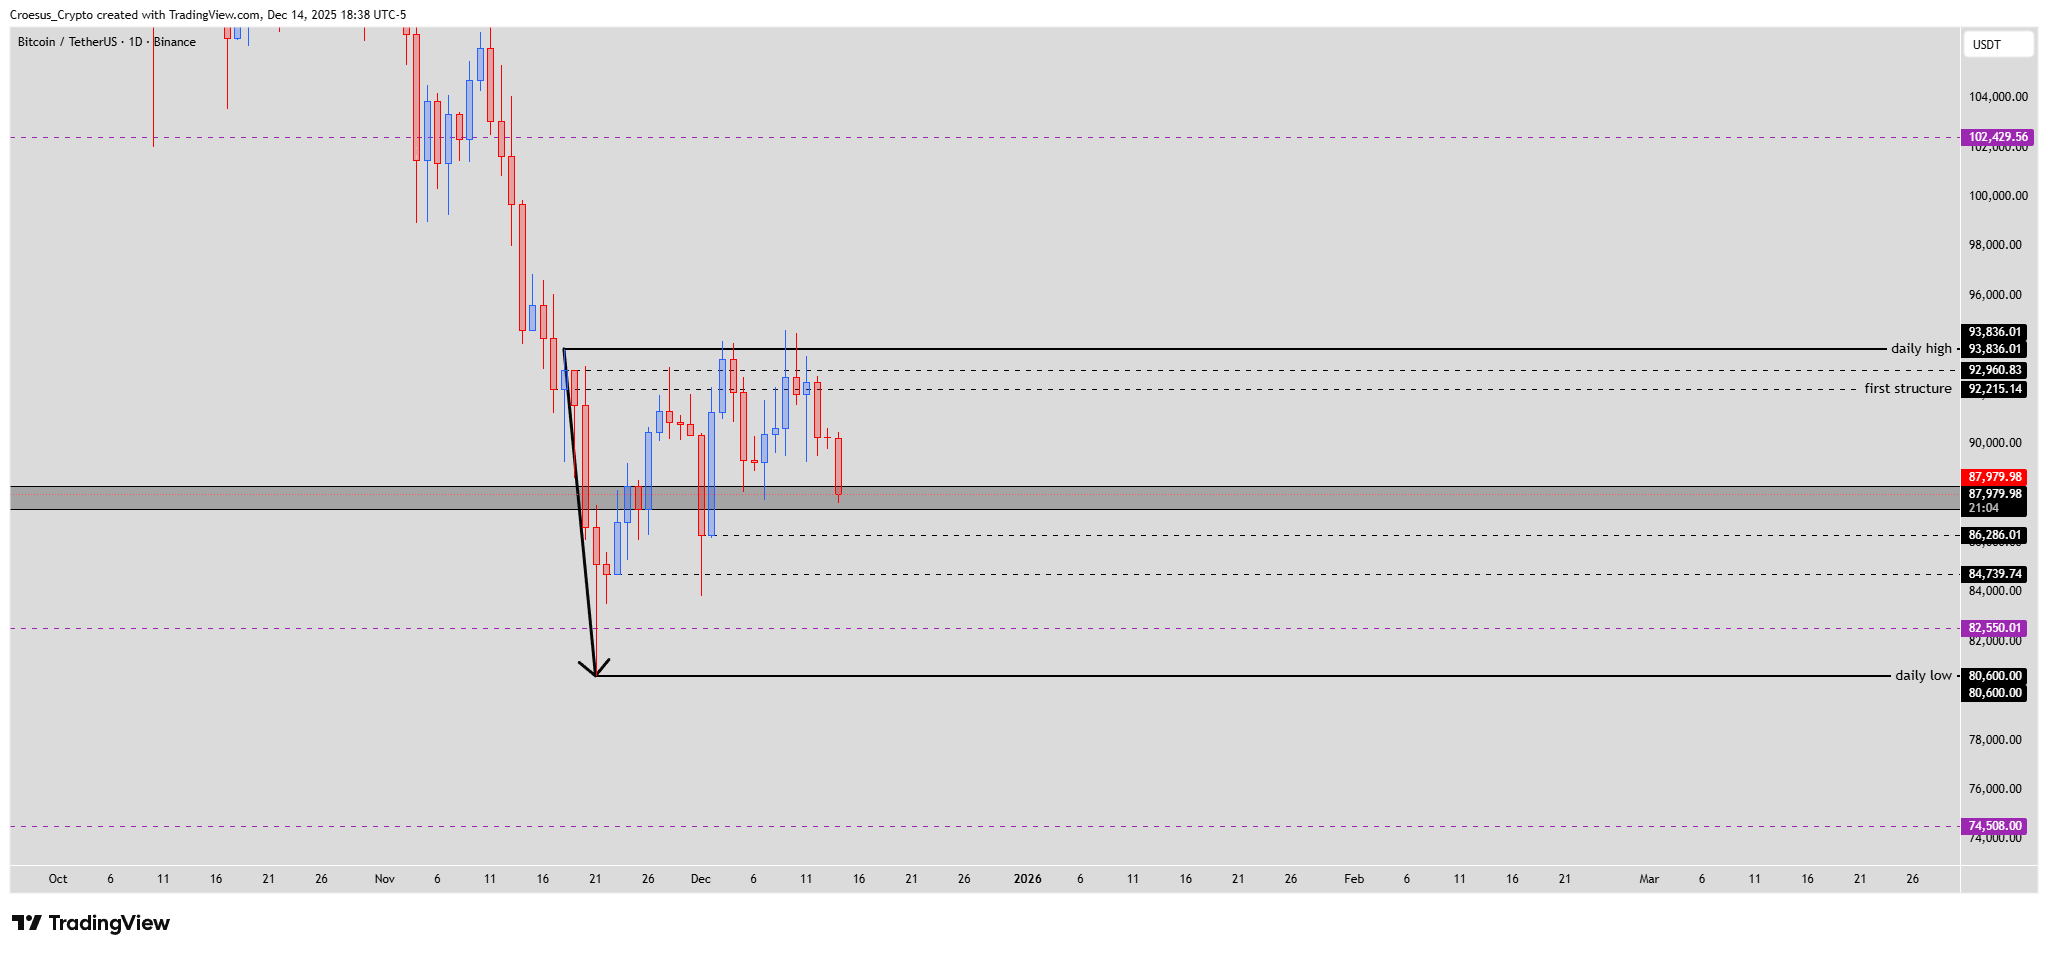
In this BTC daily analysis for 14 December 2025 we focus on today’s strong sell-off into the identified IC (institutional candle) zone after an already impulsive leg down from the local range highs. Our technical analysis tracks how price behaves around this key support resistance band to confirm or invalidate the developing inverse head and shoulders structure.
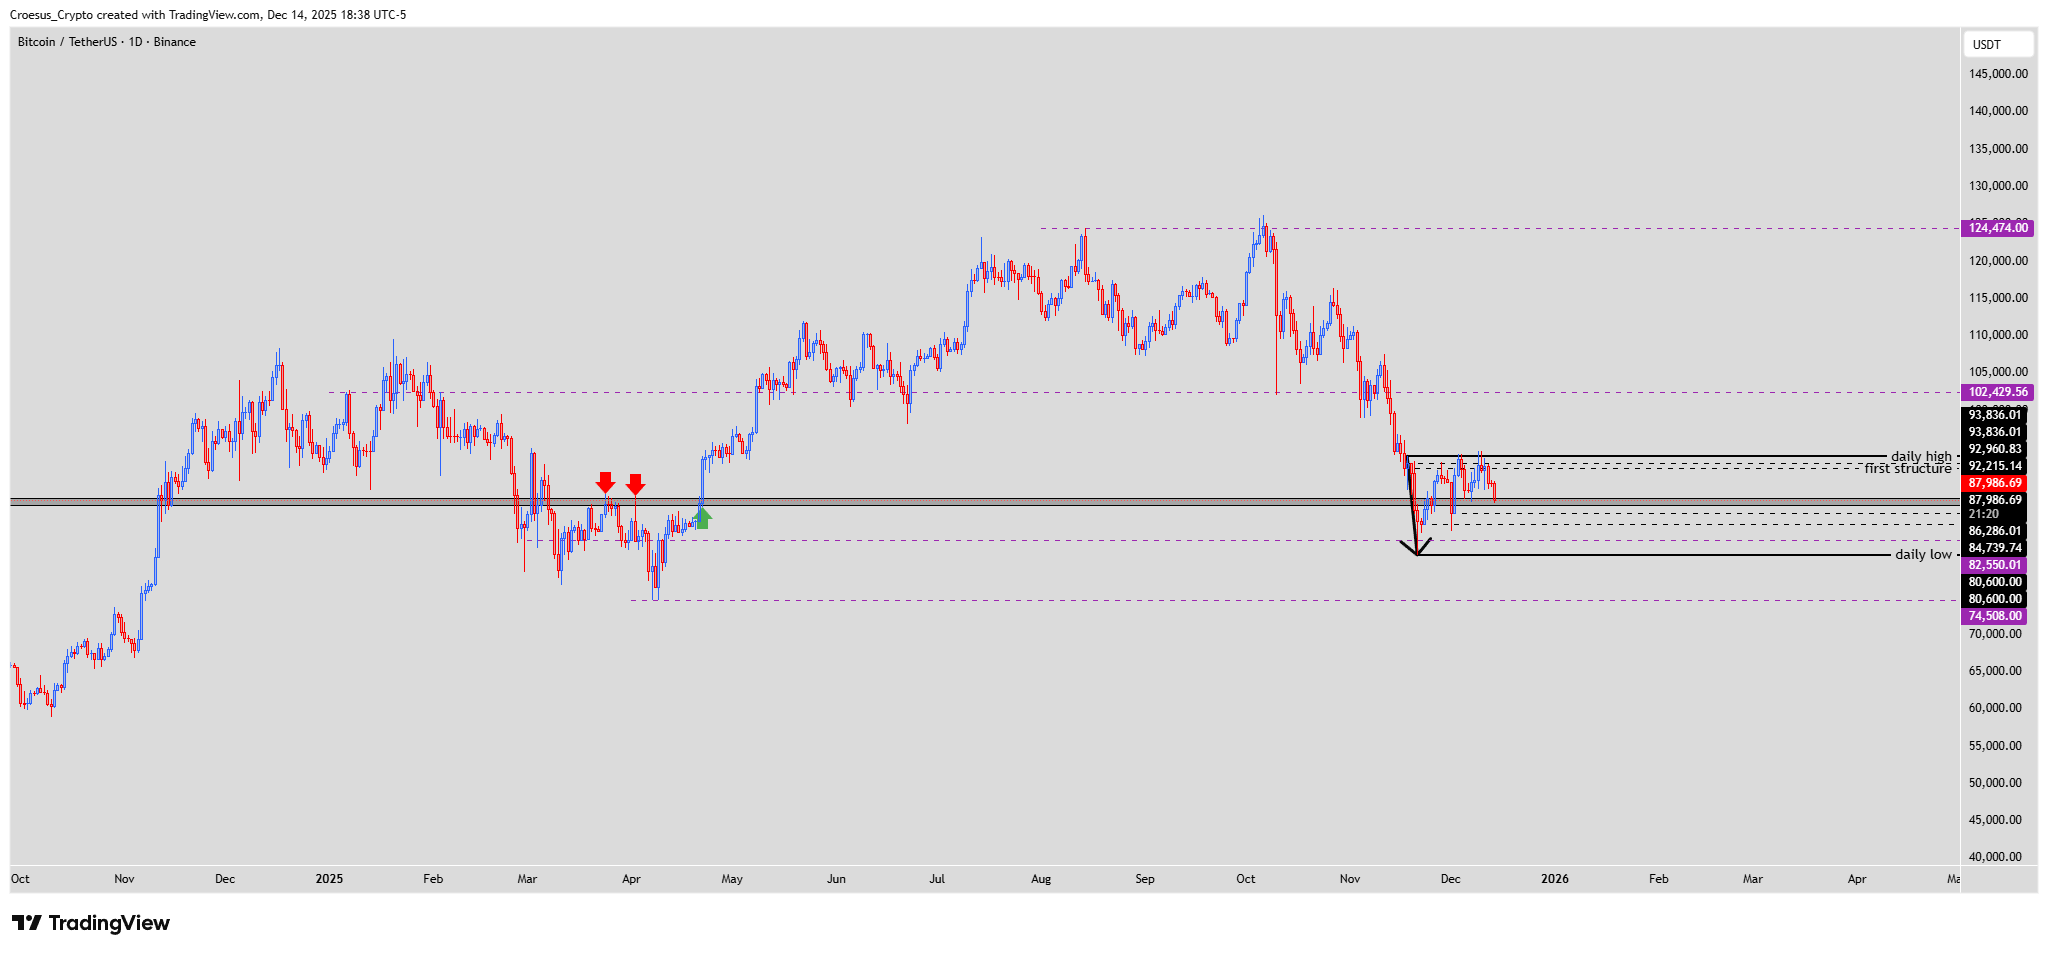
BTC daily chart 14 Dec 2025 highlighting historical reactions at IC zone, current range between 93.8k daily high and supports down to 80.6k daily low.
Technical Analysis Key Points
- On Friday the price pushed down quite impulsive.
- On Saturday we saw an indecision candle, but today the price made a strong sell-off.
- Price dropped into an important area, the IC zone.
- If we can close above it, we can use this level as support, and the inverse head and shoulders pattern remains valid. Still, this doesn't give us any garanties.
- If we loose this level and close below it, the pattern is invalidated and we are preferring the head and shoulders pattern.
Market Structure Analysis
This BTC daily analysis shows a clear sequence: impulsive drop, brief pause via indecision candle, then renewed selling straight into the IC zone around 87.9k. Historically this area acted as a strong decision point, with multiple reactions visible on the left of the chart, reinforcing its role as a key support resistance region.
As long as daily candles close above this IC block, buyers can still justify the inverse head and shoulders narrative, with the recent low acting as the head.
A daily close below the zone would invalidate that bullish structure and instead confirm a broader head and shoulders top, opening room for continuation toward the lower range supports.
We do not rely on precise Fibonacci confluence here; price action at the IC zone is the main signal in this technical analysis.
Key Levels and Scenarios
Bullish scenario: A strong daily close back above the IC zone (~87.9k) with follow-through into the 92.2k–92.9k first structure area would keep the inverse H&S in play and target a potential retest of the 93.8k daily high.
Key levels to watch
93,836 daily high: main upside target if bulls regain control.
92,960 / 92,215 first structure: resistance band to clear to confirm renewed strength.
IC zone around 87,9k: pivotal support; closing above preserves inverse H&S.
82,550 mid-support: intermediate target if IC breaks.
80,600 daily low: major downside objective if the head and shoulders continuation unfolds.
Trading Implications
For this BTC daily analysis we see the IC zone as a binary area: aggressive traders might fade wicks into it with tight stops below, while conservative participants may wait for a confirmed close above or below the zone before positioning, keeping risk per trade modest.
This is not financial advice; always do your own research and manage your risk appropriately.