


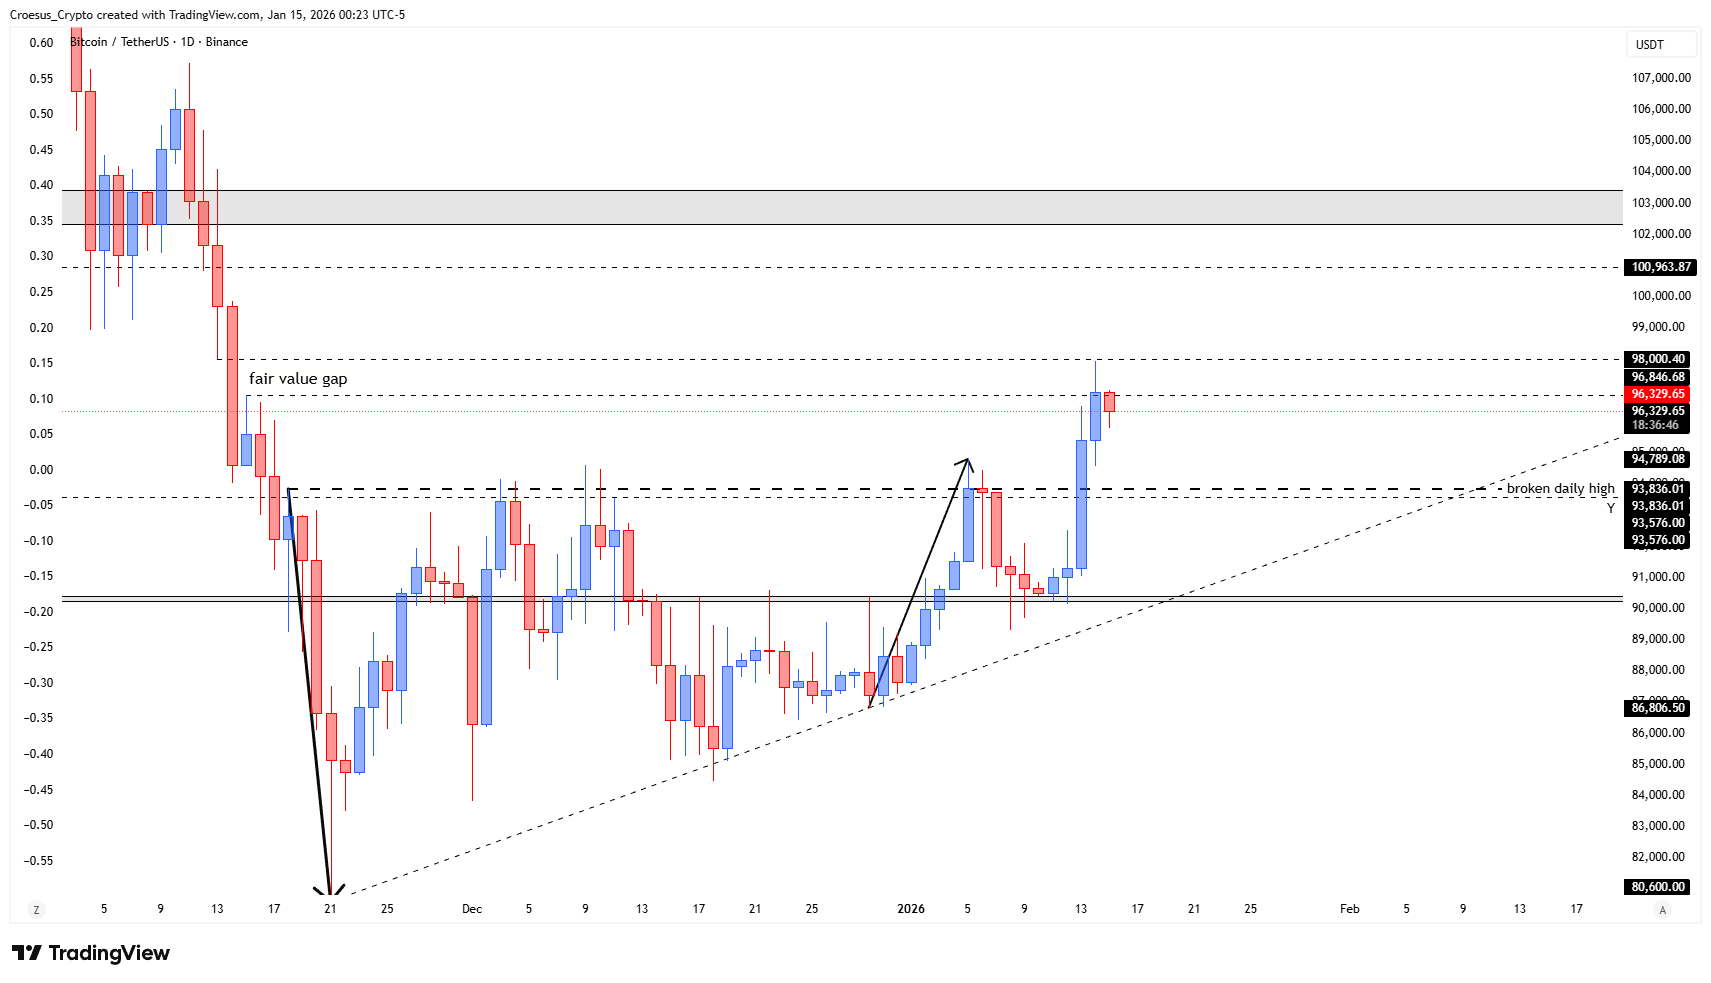
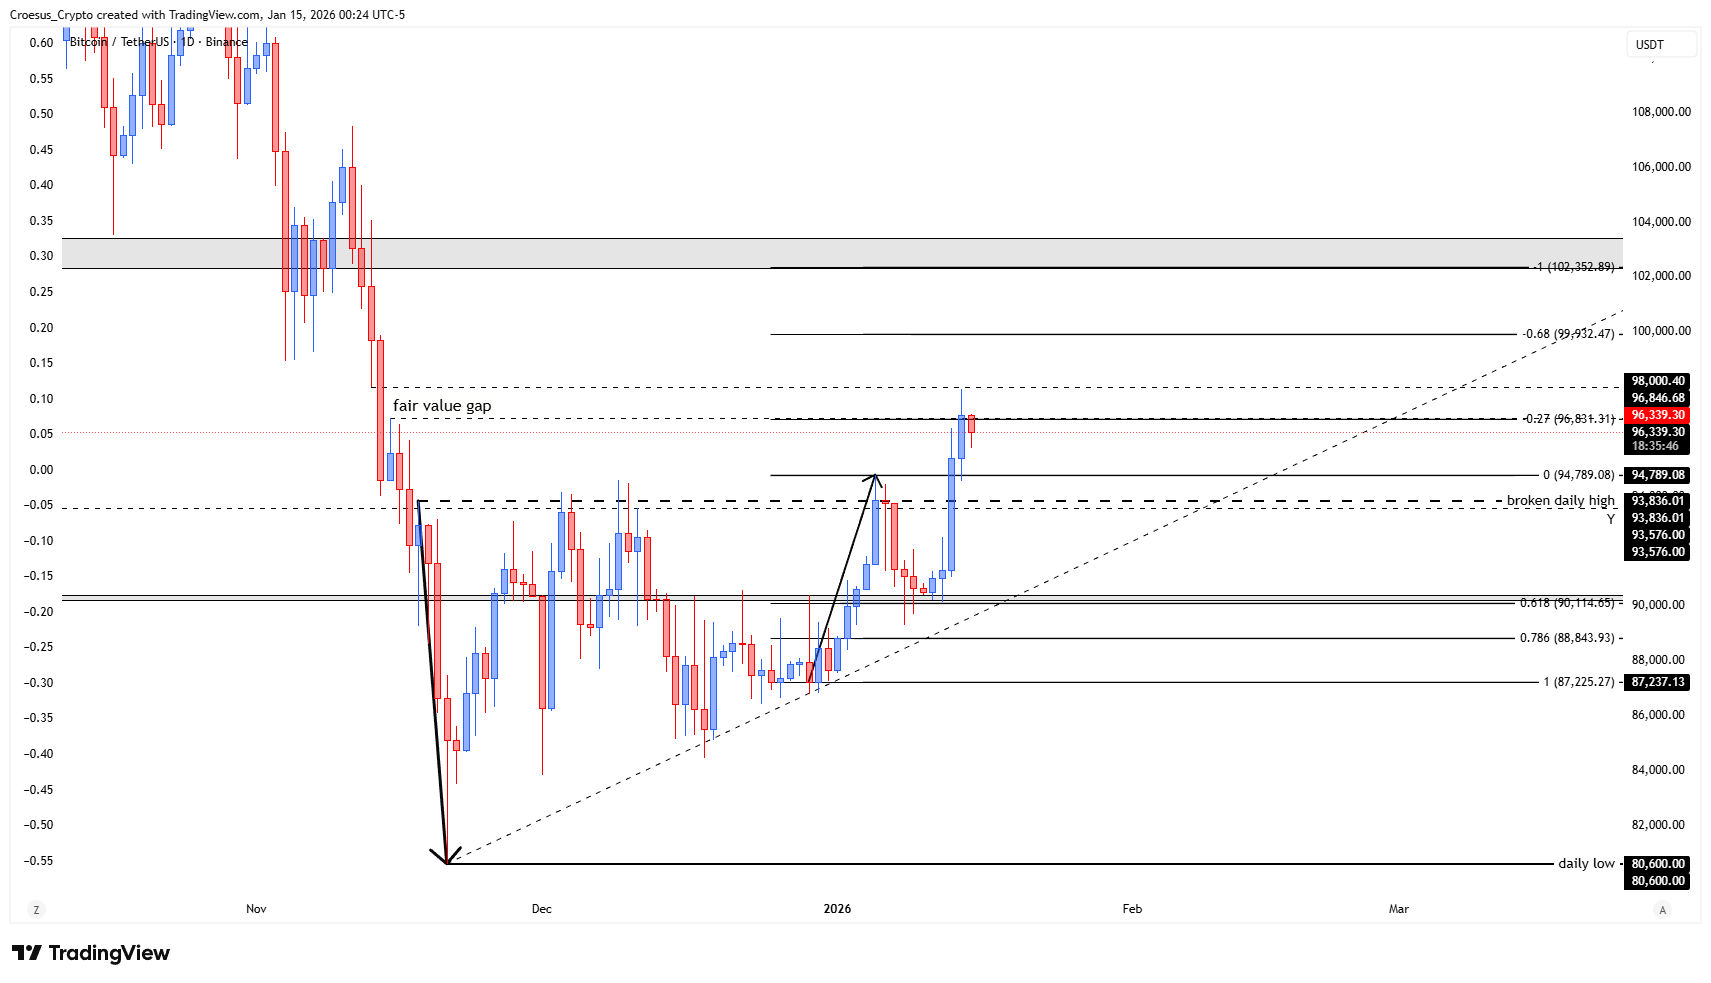
In this Bitcoin daily analysis for 14 January 2026, we see BTC breaking out of its established daily range and trading firmly above the prior broken daily high. Price has extended into the Fibonacci -0.27 completion area, where our technical analysis suggests the first upside objective of this leg has been achieved and short-term relief is likely.
Bitcoin daily chart 14 January 15, 2026 with breakout above broken daily high, Fibonacci -0.27 extension and nearby resistance zones.
Technical Analysis Key Points
- same same as on the TOTAL chart. Break out and touching the fib -0.27 completion. Expect some relief.
Market Structure Analysis
Our Bitcoin daily analysis shows a clean impulsive move off the rising trendline from the December low, pushing through multiple intraday and daily highs before stalling at the Fibonacci -0.27 extension. This area now acts as local resistance, capping the first expansion leg after the range.
Below price, the broken daily high and the body/low of the last impulsive candle form a stacked support zone. A controlled retrace into this area would be typical after such an impulsive breakout and would help rebalance the fair value gap left behind. As long as price holds above this reclaimed structure and the ascending trendline, the broader bullish structure on the daily timeframe remains intact.
Key Levels and Scenarios
Bullish scenario: A shallow pullback toward the breakout candle low and broken daily high, followed by strong buying reaction and a daily close back toward the Fib -0.27 area, would keep upside continuation in play toward the next resistance band and higher Fibonacci targets.
Key levels to watch:
Fib -0.27 completion zone – immediate resistance and current reaction area.
Broken daily high – key support resistance flip on any relief move.
Low of the last impulsive daily candle – main demand zone for dip buyers.
Rising daily trendline from December low – structural trend support.
Prior range floor – deeper downside invalidation if decisively lost.
Trading Implications
Traders may wait for relief into the breakout zone and confirmation of support holding before considering new longs, with tight risk management and stops placed below the impulsive candle low to preserve an attractive risk/reward profile.
This is not financial advice; always do your own research and manage your risk appropriately.