


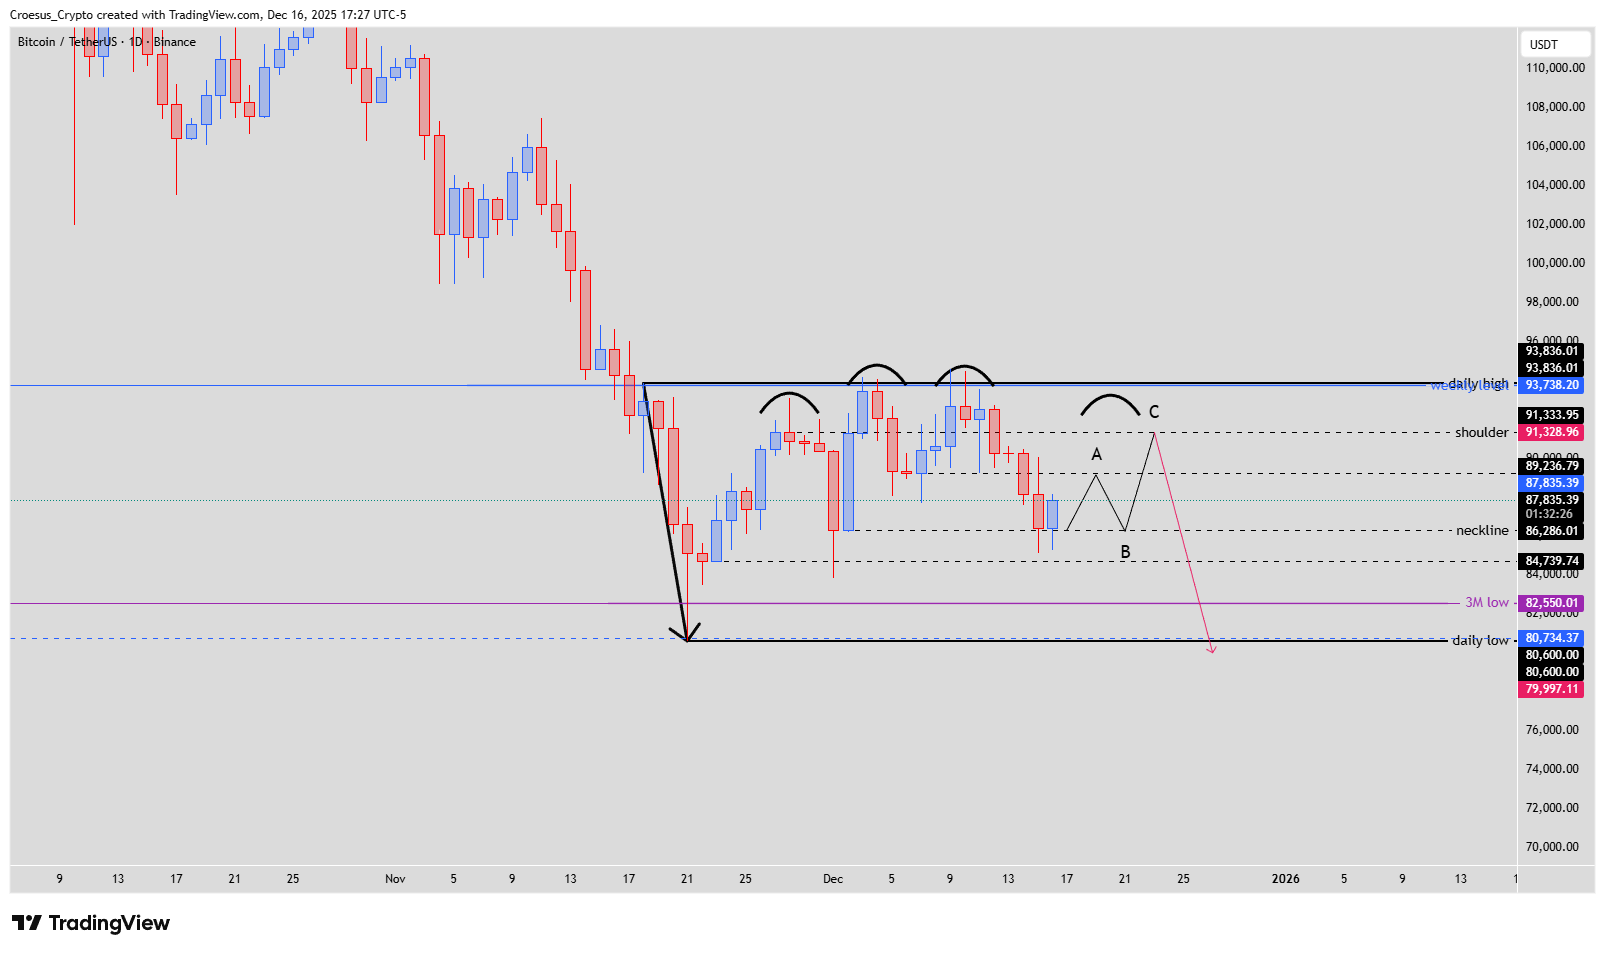
In this Bitcoin daily analysis we focus on the strong impulsive selloff that defined the current range and the corrective structure that followed. Price action has shifted from a clear bearish impulse into a choppy consolidation where a head and shoulders pattern is now visible inside the same daily range, keeping a bearish continuation scenario on the table in our technical analysis.
Bitcoin daily chart Dec 2025 with three-candle bearish impulse, 25-day corrective range, head and shoulders, neckline reaction and projected ABC path
Technical Analysis Key Points
- impulsive bearish leg down of three candles, setting the daily range
- followed by a corrective phase of, in the meanwhile, 25 days
- formation of a head and shoulders pattern within this daily range
- after tapping the neckline yesterday, price made a slight bullish reaction today
- possibly starting an ABC correction towards the right shoulder.
- this could initiate a bearish continuation towards the 3M or the weekly/daily low
Market Structure Analysis
The chart starts with a three-candle impulsive bearish leg that aggressively breaks prior support and sets the new daily low, effectively defining the current trading box between that low and the upper resistance around the daily high.
Since then, Bitcoin has spent about 25 days in a corrective phase: overlapping candles, mixed reactions, and sideways price action, typical behaviour after a strong impulse.
Within this range, price has formed a head and shoulders pattern at the upper boundary, with the neckline drawn around the mid-range support level.
Yesterday’s tag of this neckline led to a slight bullish reaction today, suggesting short-term buyers stepping in but still operating within a broader consolidation.
Key Levels and Scenarios
Main resistance levels
93.8k – Daily high / range high : Top of the whole structure and head of the pattern. A reclaim/close above here would weaken the bearish H&S idea.
91.3k – Shoulder / right-shoulder resistance : Target for a potential C-leg of the ABC correction. As long as BTC stays below this, the move up looks corrective.
~89.2k – Mid-range resistance : Interim level that could cap the A-leg of the bounce; also a place where shorts may start to re-enter.
Support levels
86.3k – Neckline : Pivotal level. Current bounce is coming from here. A clean daily close below would confirm the head & shoulders breakdown.
~84.8k – Local range support : Short-term support inside the box. If lost, it increases the chance we revisit the neckline and break it.
82.6k – 3M low : First major downside target if the pattern plays out; strong support and potential take-profit area for shorts.
80.6k–80.7k – Weekly/Daily low cluster : Deeper support zone below the 3M low; marks the lower extension of the bearish continuation scenario.
Trading Implications
As long as price trades below the shoulder resistance, we treat bounces as corrective within a dominant bearish context; traders may look for confirmation around the neckline and shoulder area while managing risk carefully around these key levels.
This is not financial advice; always do your own research and manage your risk appropriately.