


BTC Marketcap / Bitcoin
In this Bitcoin daily analysis for 16 February 2026, we observe the same corrective structure that appeared on the TOTAL chart. After a sharp selloff, BTC is attempting to stabilise in a potential ABC pattern while still sitting inside a broader corrective range. Our technical analysis focuses on how this structure could evolve and which support resistance levels matter most for active traders.
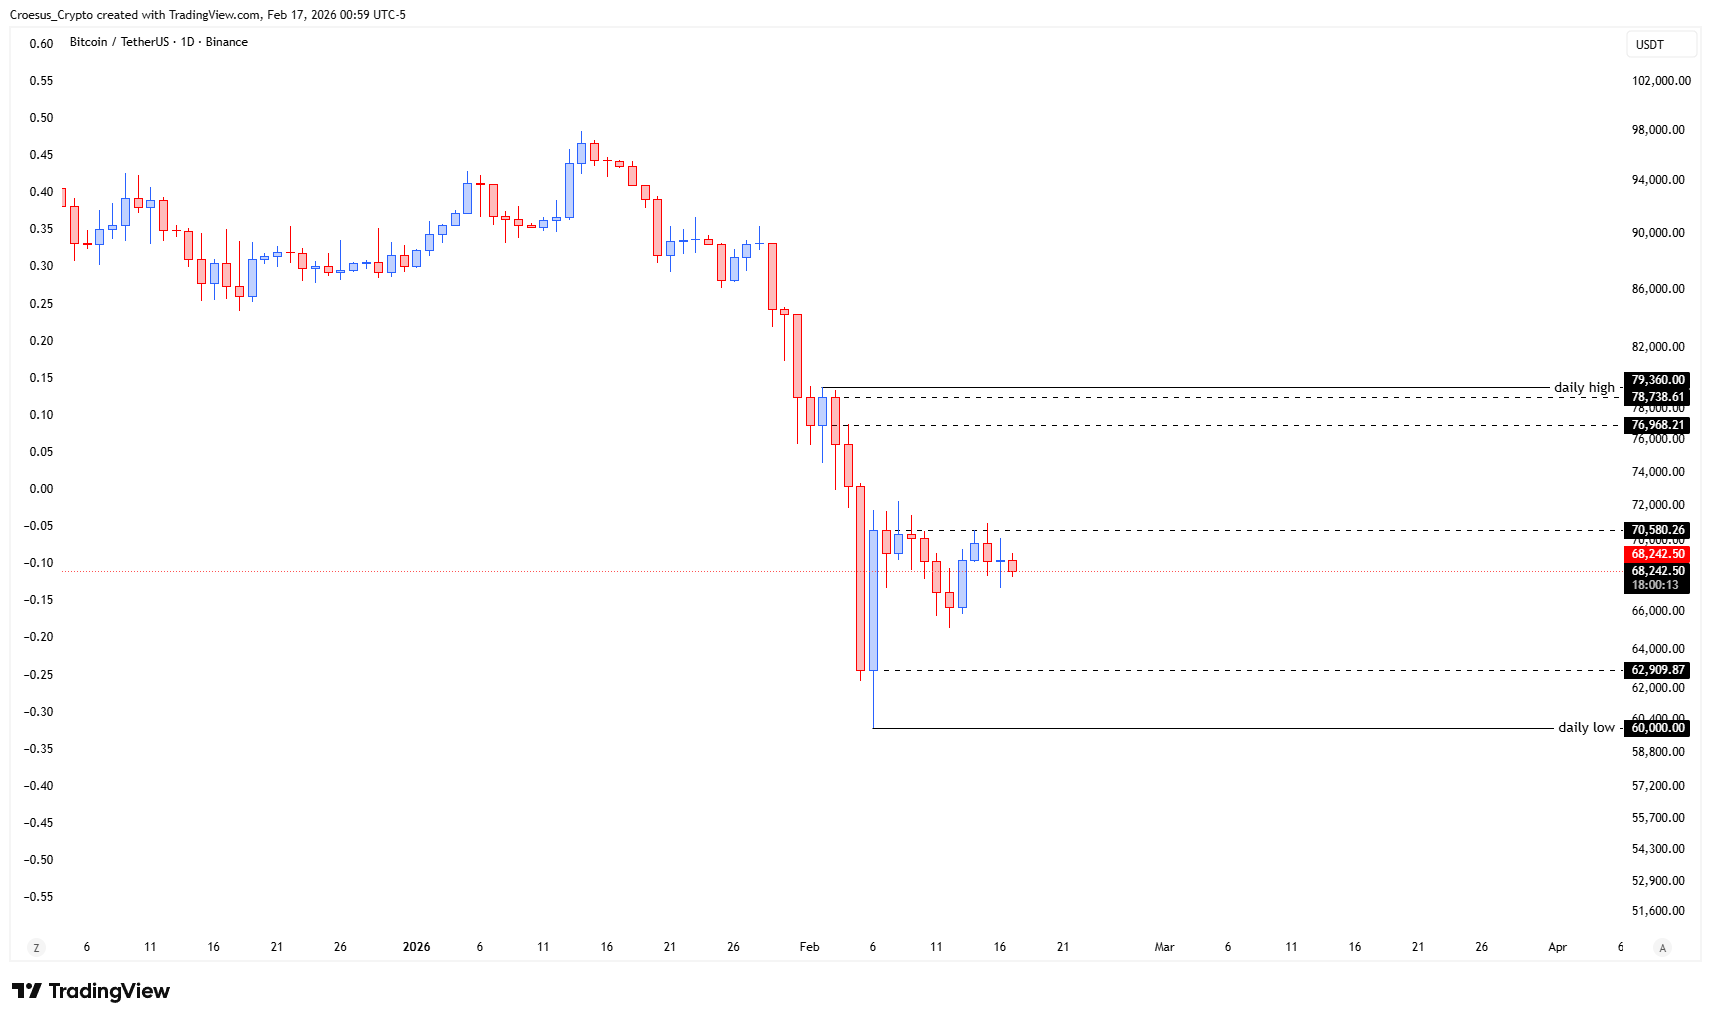
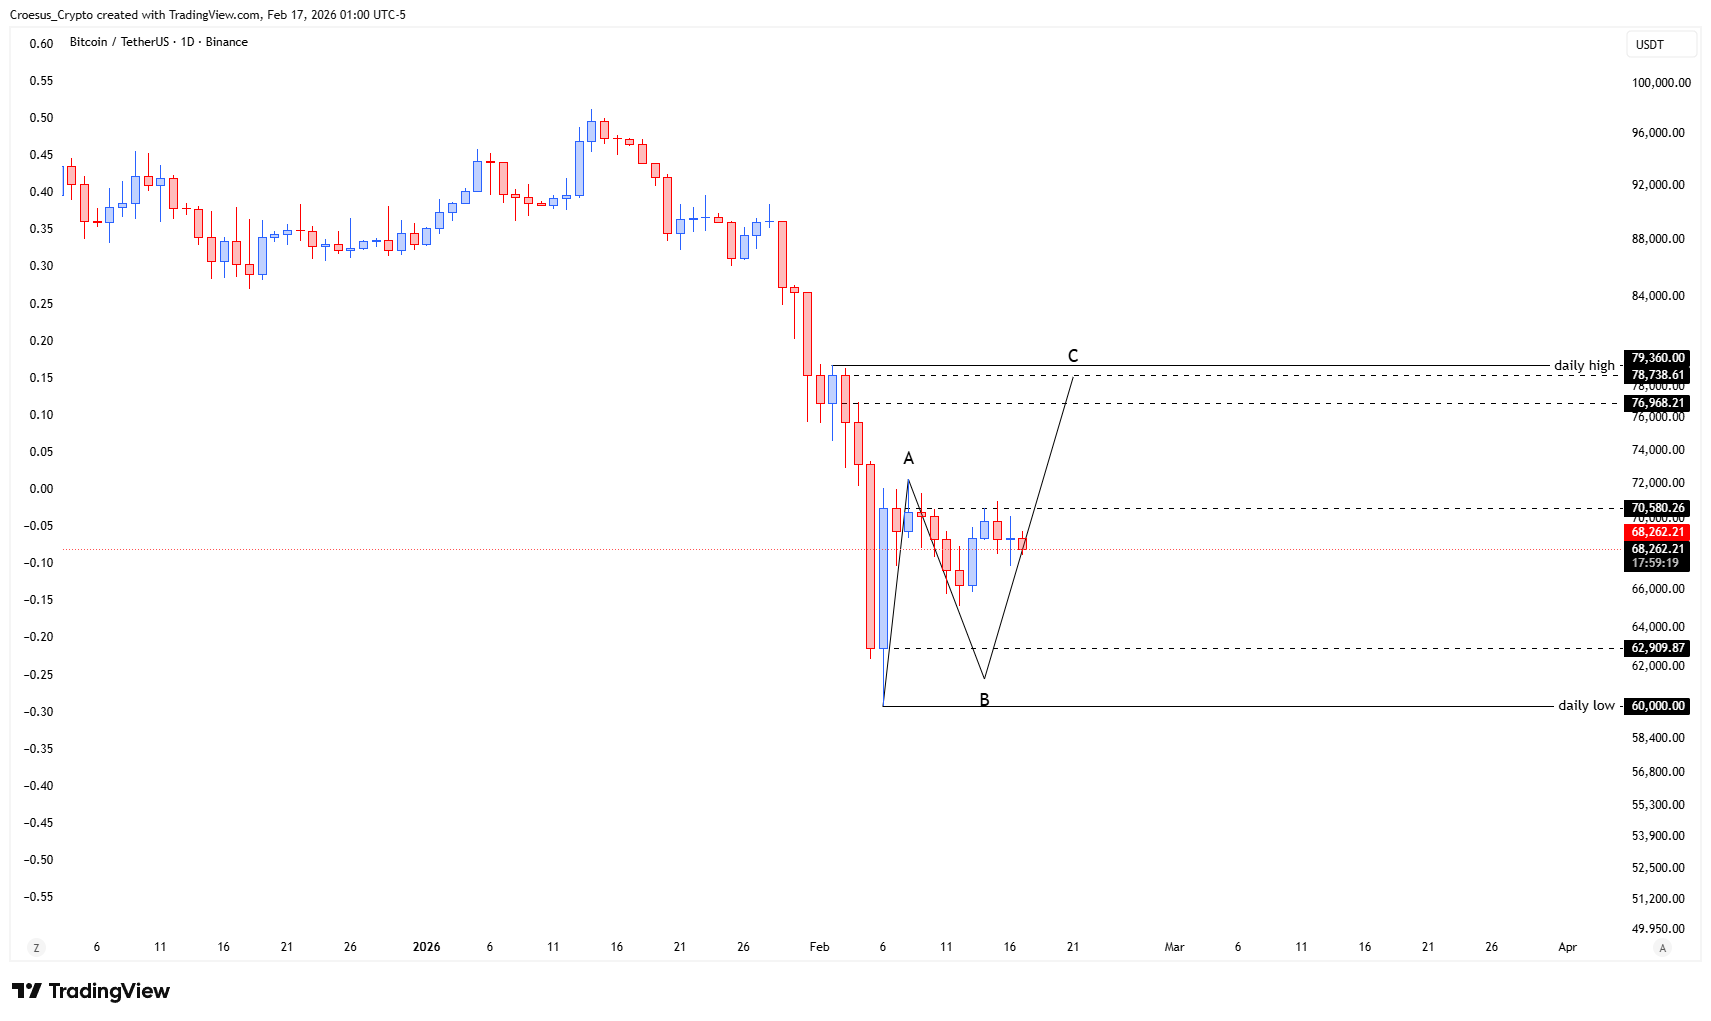
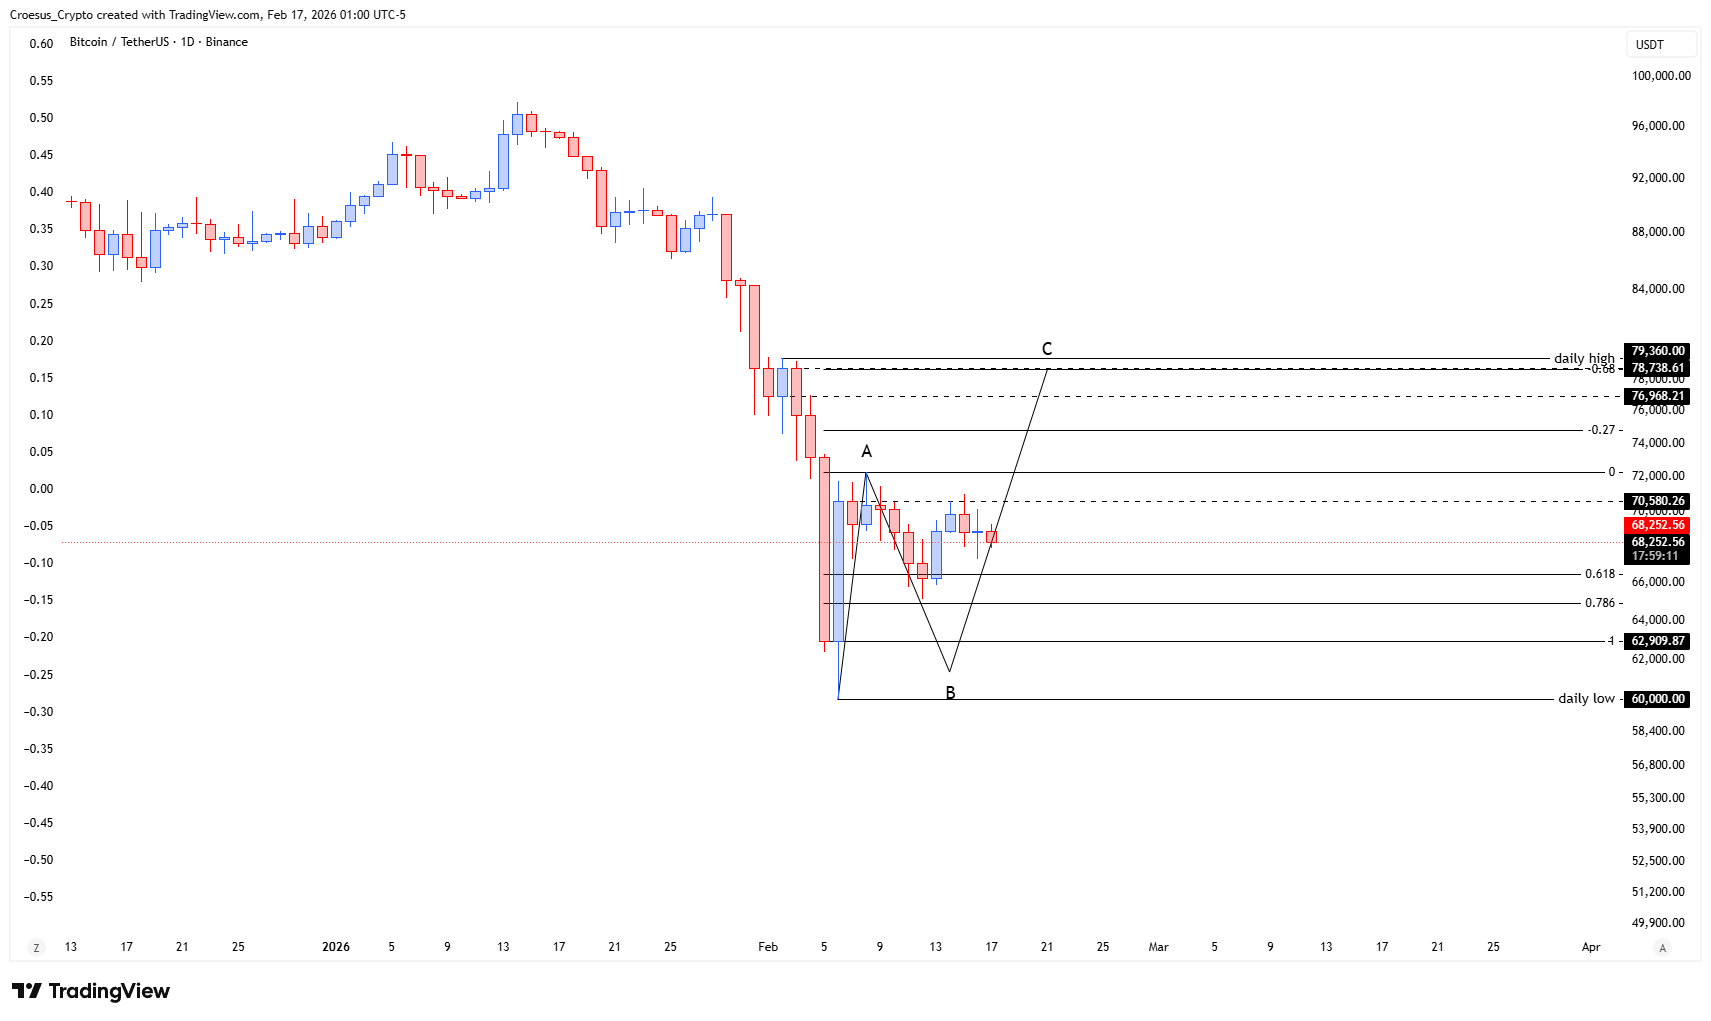
- same pattern as with the TOTAL chart : we can still see an ABC correction playing out.
Market Structure Analysis
Our Bitcoin daily analysis shows price rebounding from the daily low region around $60,000 and trading in a sideways band beneath the A-swing high just above $70,000. This reinforces the idea of an unfolding ABC correction following the strong impulse down. As long as the B low near the recent wick remains intact, a C-leg push towards the prior daily high around $79,000 remains on the table. The upper region just below the daily high also aligns with visible Fibonacci extension levels on the chart, creating a natural upside target area where supply may re-enter. Until that C-leg confirms, BTC is effectively range-bound between the daily low support zone and mid-range resistance.
Key Levels and Scenarios
Bullish scenario (corrective): If buyers defend the $60,000–63,000 zone and reclaim the A-swing area around 70,500 on a daily close, the C-leg of the ABC structure could extend into the $76,000–79,000 resistance band, where we expect sellers to react.
Critical levels to watch:
- $60,000 – daily low and key downside invalidation level.
- $63,000 – intermediate support around the B low region.
- ~$70,500 – A-swing / range resistance; reclaim would strengthen the corrective rally.
- $76,000–79,000 – higher resistance cluster and potential C-leg completion zone, overlapping with Fibonacci projections.
Trading Implications
From a technical analysis standpoint, any long positioning here is a tactical play within a correction: traders may look for entries near support with tight stops below 60,000 or wait for confirmed closes above 70,500, keeping position sizes modest due to the strong preceding downtrend and respecting all marked support resistance levels.
This analysis is for informational purposes only and does not constitute financial advice.