BTC Marketcap / Bitcoin
BTC daily analysis 16/03/2026. Bitcoin is trading in a bearish context while price pushes higher into overhead resistance, leaving the market at a decision point between a final sweep of the daily highs or a relief pullback into prior structure.
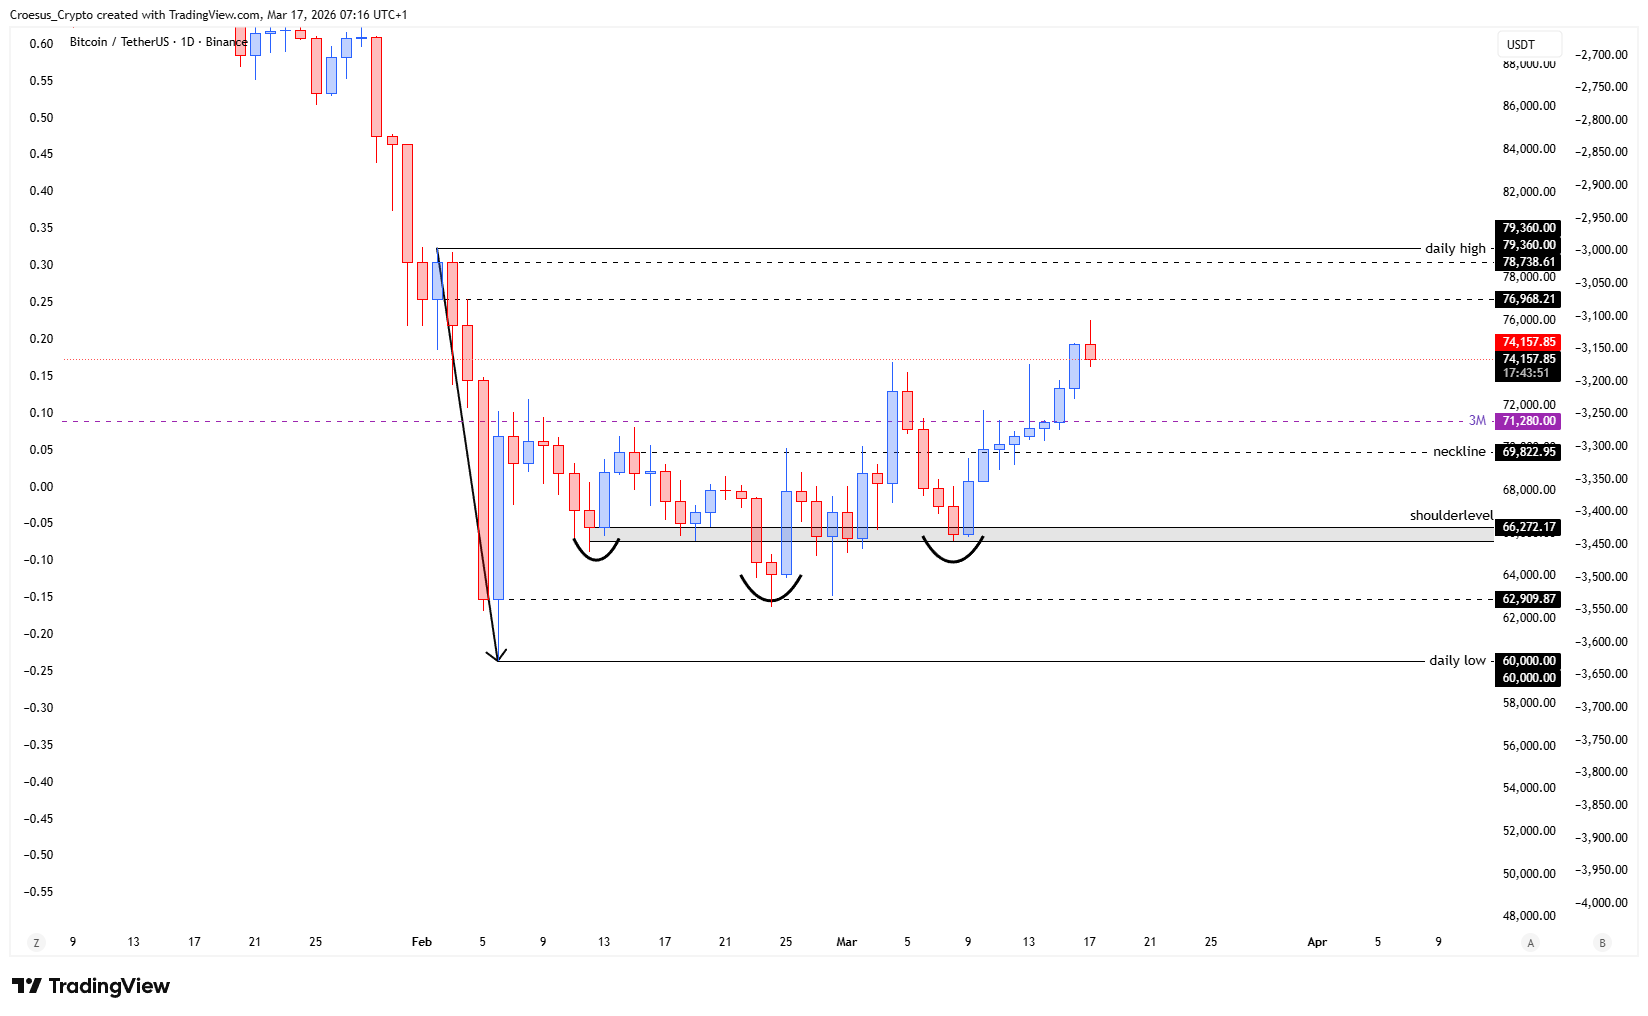
- BTC shows us the price pushing higher until just below the daily highs
- Will we see a further continuation until the daily highs or do we see a relief first retesting the 3M level or the neckline ?
Market Structure Analysis
Our BTC daily analysis focuses on how price behaves as it compresses just below the daily highs. In a bearish trend, this type of upward push often reads as a corrective leg into resistance rather than a clean impulsive continuation, especially if the move stalls and starts printing rejection near the range high.
Structurally, the key question is whether buyers can reclaim the daily highs with acceptance, or whether this area acts as a supply zone that triggers a rotation back into support resistance below. The references to the neckline and the 3M level, which we treat as major horizontal decision zones: if price fails to break higher, a pullback into these levels would be a typical retest of prior structure before the next directional move.
Key Levels and Scenarios
BTC daily analysis remains bearish unless price proves acceptance above the daily highs. A bullish deviation-through-resistance is possible, but the more conservative read is that price is testing overhead liquidity and may rotate back into the neckline / 3M level area if momentum fades.
- Daily highs: immediate resistance and potential liquidity zone if price wicks through and rejects
- Neckline: first structural area to watch for a relief retest and reaction
- 3M level: broader support area where buyers would need to defend to avoid continuation lower
Trading Implications
In this bearish environment, aggressive traders typically look for confirmation around the daily highs (rejection vs acceptance), while conservative traders often wait for the market to show its hand via a clean break and retest of resistance, or a controlled pullback into the neckline / 3M support resistance zone. Risk stays elevated while price sits at the top of the current structure.
This analysis is for informational purposes only and does not constitute financial advice.