BTC Marketcap / Bitcoin
BTC Daily Analysis 17/03/2026. Bitcoin shows early signs of a momentum shift as the prior upside push stalls and the first clear bearish indicational candle prints, putting the recent leg up into a more cautious, bearish context.
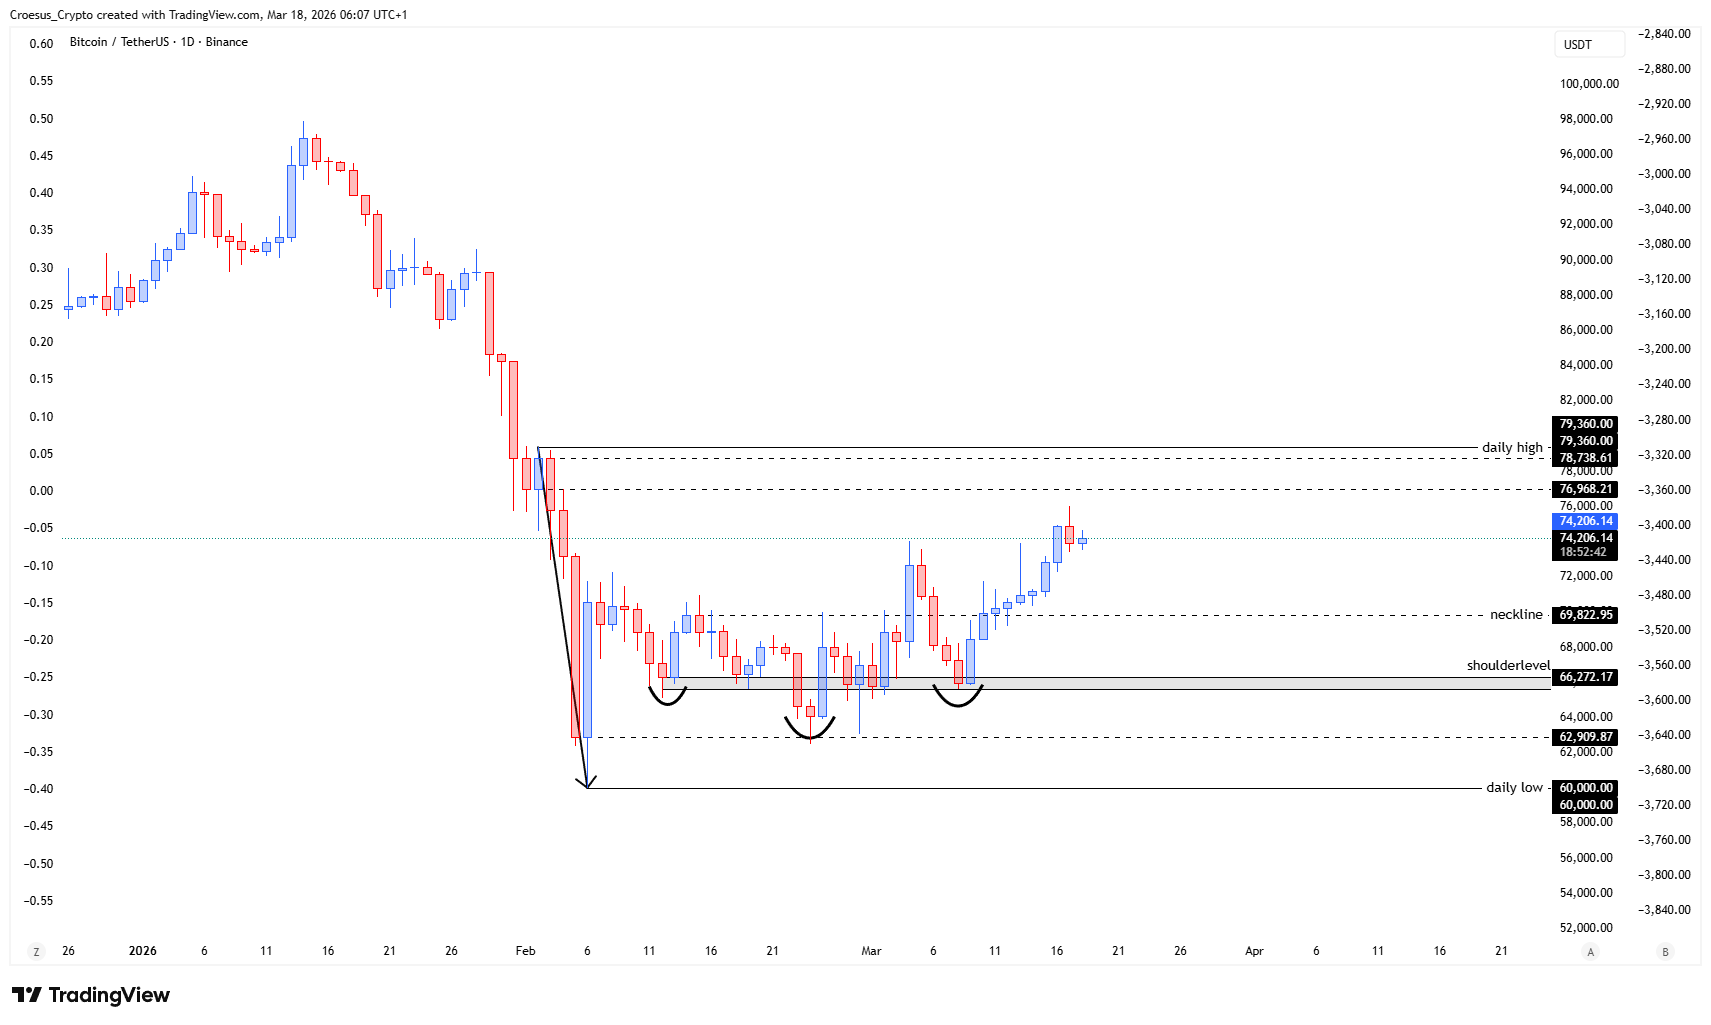
- BTC shows us the price stopped in its upwards move, printing a first bearish candle, an indicational candle
- If we take the Fibonacci retracement from the last leg up, we can clearly see the neckline aligning with the fib 0.618 and the daily high with the -0.27.
Market Structure Analysis
Our BTC daily analysis focuses on how price behaves after the last impulsive leg up. The market is no longer extending cleanly higher and instead prints a first bearish candle, which often acts as an early warning that buyers are losing control and that price may shift into a corrective structure.
In naked trading terms, that typically means the market transitions from an impulse phase into a pullback that starts probing prior demand zones and key horizontal support resistance levels. The Fibonacci mapping adds confluence to that structural read: with the neckline aligning at the 0.618 retracement, that area becomes a high-interest zone where a deeper correction can stabilize or where a breakdown can accelerate. On the upside, the daily high aligning with the -0.27 level highlights where the prior expansion topped out, helping frame the current swing high reference for any retest or rejection.

Key Levels and Scenarios
In this BTC daily analysis, the bearish scenario stays in play while price holds below the recent daily high expansion area, with the market more likely to rotate into a deeper corrective move. A constructive recovery would require price to reclaim strength and negate the bearish signal, but the key decision zone remains the neckline confluence at the Fibonacci 0.618.
- Neckline area aligned with Fibonacci 0.618 (key support resistance decision zone)
- Recent daily high aligned with Fibonacci -0.27 (swing high reference and rejection risk zone)
Trading Implications
From a risk perspective, this is a higher-uncertainty inflection point: aggressive participants typically react to the first bearish signal, while conservative traders often wait for confirmation around the neckline/0.618 confluence. As long as structure remains corrective rather than impulsively reclaiming highs, downside continuation risk remains elevated.
This analysis is for informational purposes only and does not constitute financial advice.