


In this BTC daily analysis for 18 December 2025, we see Bitcoin still trading heavy after rejecting the prior range highs near 93k.
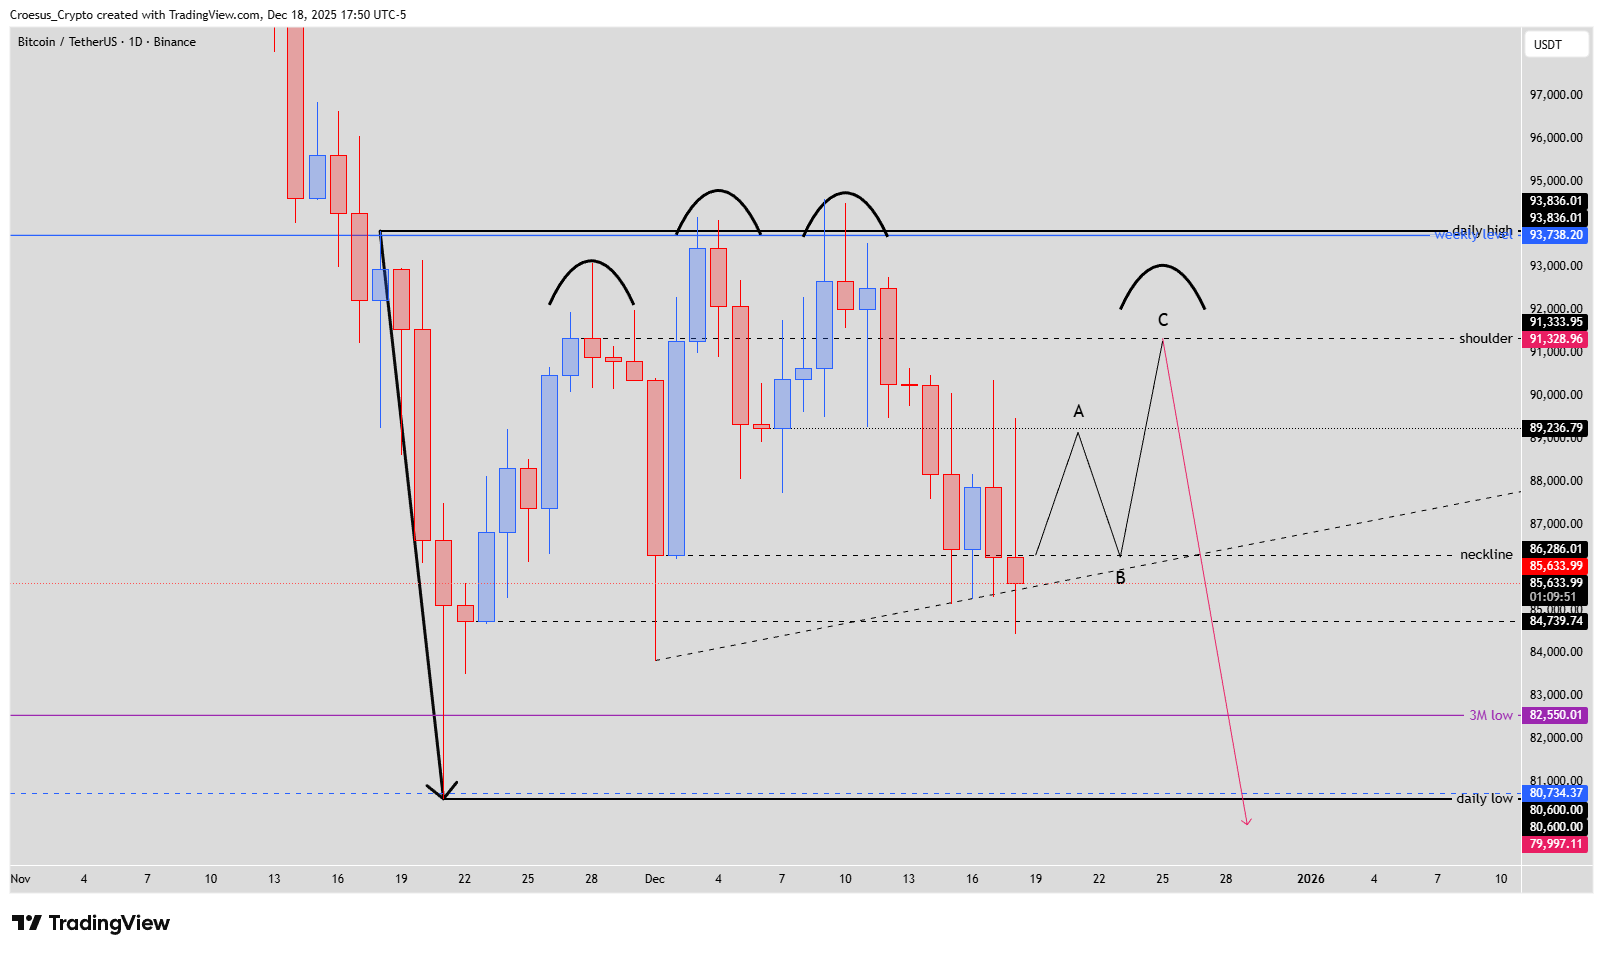
Our technical analysis centers on a potential head and shoulders reversal pattern, with price currently oscillating around the neckline area and the fake-out zone defined by recent swing lows.
For now, we focus on horizontal support resistance and do not rely on Fibonacci extensions.
BTC daily chart 18 Dec 2025 with head and shoulders structure, neckline, fake-out zone and A-B-C scenario
Technical Analysis Key Points
- Yesterday the price closed just below the neckline and moved into the fake-out zone.
- Today we saw a retest of the A-level at the beginning of the day, followed by a sharp rejection back below the neckline, testing it as resistance and sweeping liquidity below the swing lows.
- Does the head and shoulders pattern remain valid if price continues to move lower? Certainly. A head and shoulders pattern with a break of structure only reinforces the belief that bears want to stay in control, possibly after a relief rally toward the shoulder level.
Market Structure Analysis
BTC continues to respect the wider range, with resistance set by the daily highs around 93–94k and support closer to the 81k daily low.
The neckline around 86k is acting as a pivot: repeated failures to close convincingly above it keep the head and shoulders pattern valid and point to seller dominance. The fake-out zone just below the neckline shows absorption of dip-buying and aggressive liquidity sweeps under local swing lows, which typically precede either a sharper breakdown or a strong relief rally back toward the shoulder region around 91k.
A daily close above the shoulder would invalidate the topping structure; a decisive move below the 3M low near 82.5k would confirm bearish continuation.
Key Levels and Scenarios
Bullish scenario: buyers need to reclaim the neckline (~86k), then push toward the A-level and finally the shoulder zone (~91–92k) to negate the immediate breakdown risk.
Key levels to watch:
93–94k – daily high zone and main resistance
91–92k – shoulder zone; potential lower high
86k – neckline pivot; key intraday level
82.5k – 3M low; first major breakdown target
81k – daily low; final support before extended downside
Trading Implications
While price holds below the neckline, risk/reward favors short setups or defensive positioning, with tight invalidation above the shoulder region and cautious position sizing.
This is not financial advice; always do your own research and manage your risk appropriately.