


BTC Marketcap / Bitcoin
Our BTC daily analysis for 18 February 2026 focuses on the consolidation that has formed after the steep drop from the 79k region. On the daily timeframe, price is holding above the 66k area, mirroring the same “bored” range behaviour seen on TOTAL and ETH. This technical analysis zooms out to frame the current chop within the broader down-move and key support resistance zones.
- Trading is quite boring. We see a similar story as with the TOTAL chart. Does this support level hold or not ?
Market Structure Analysis
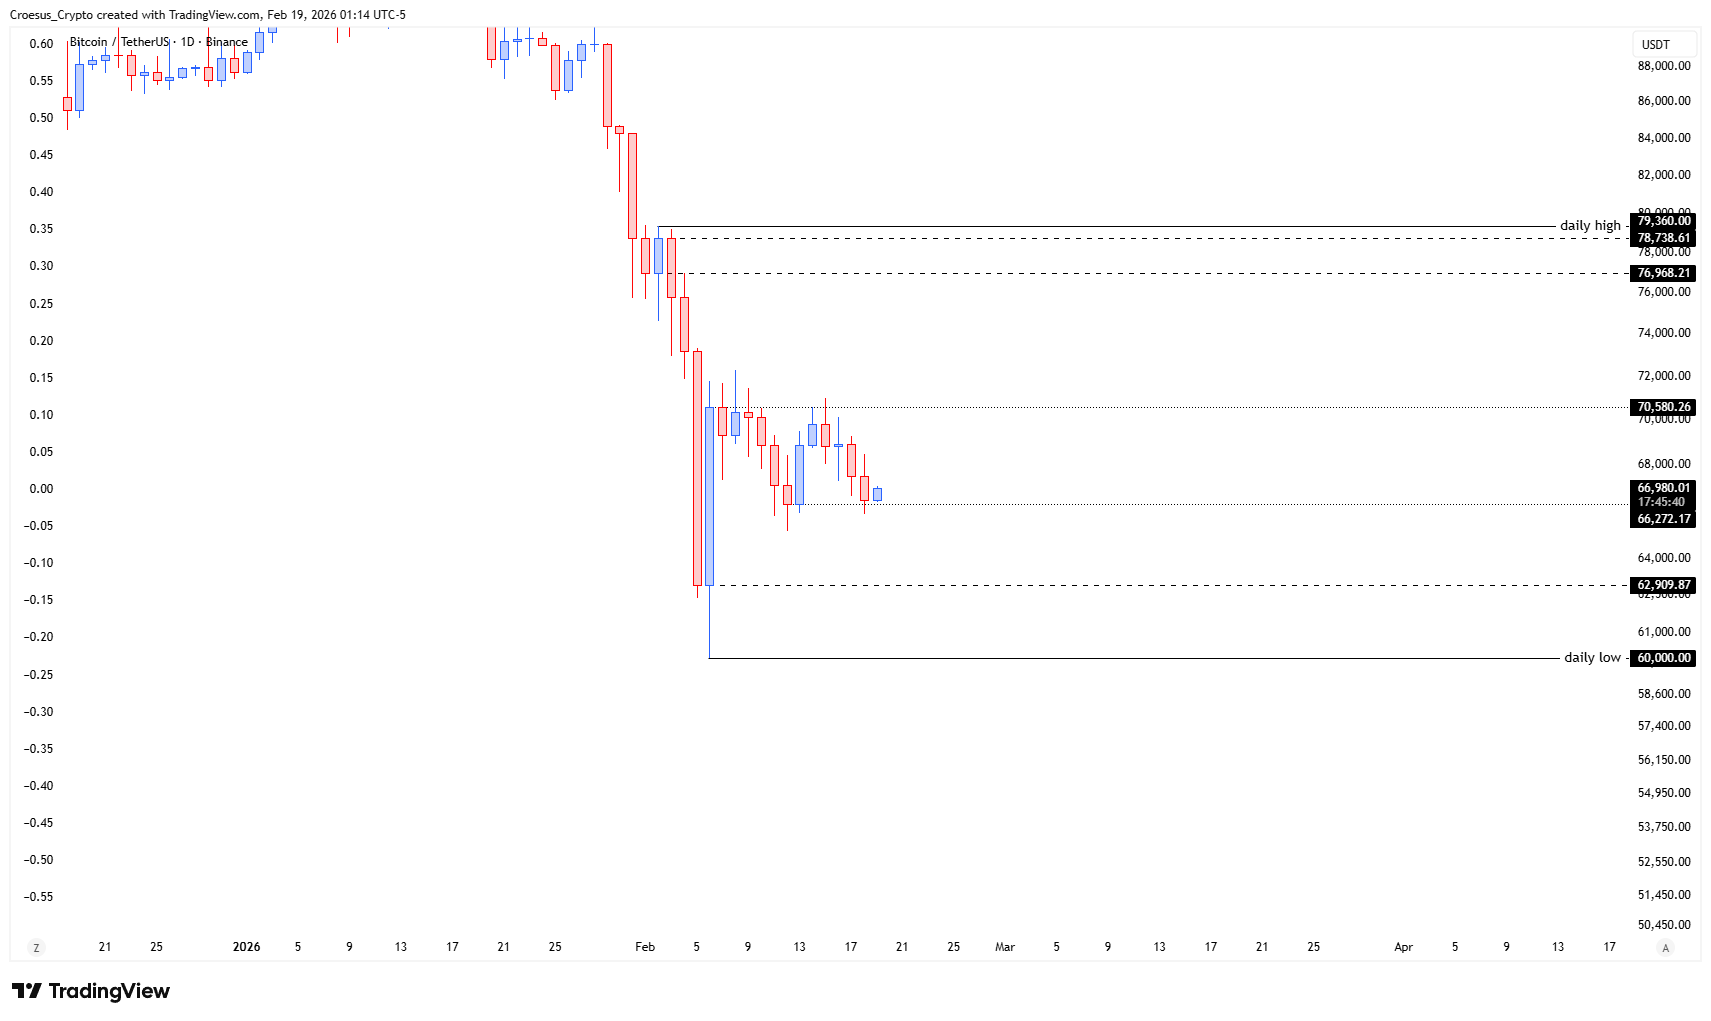
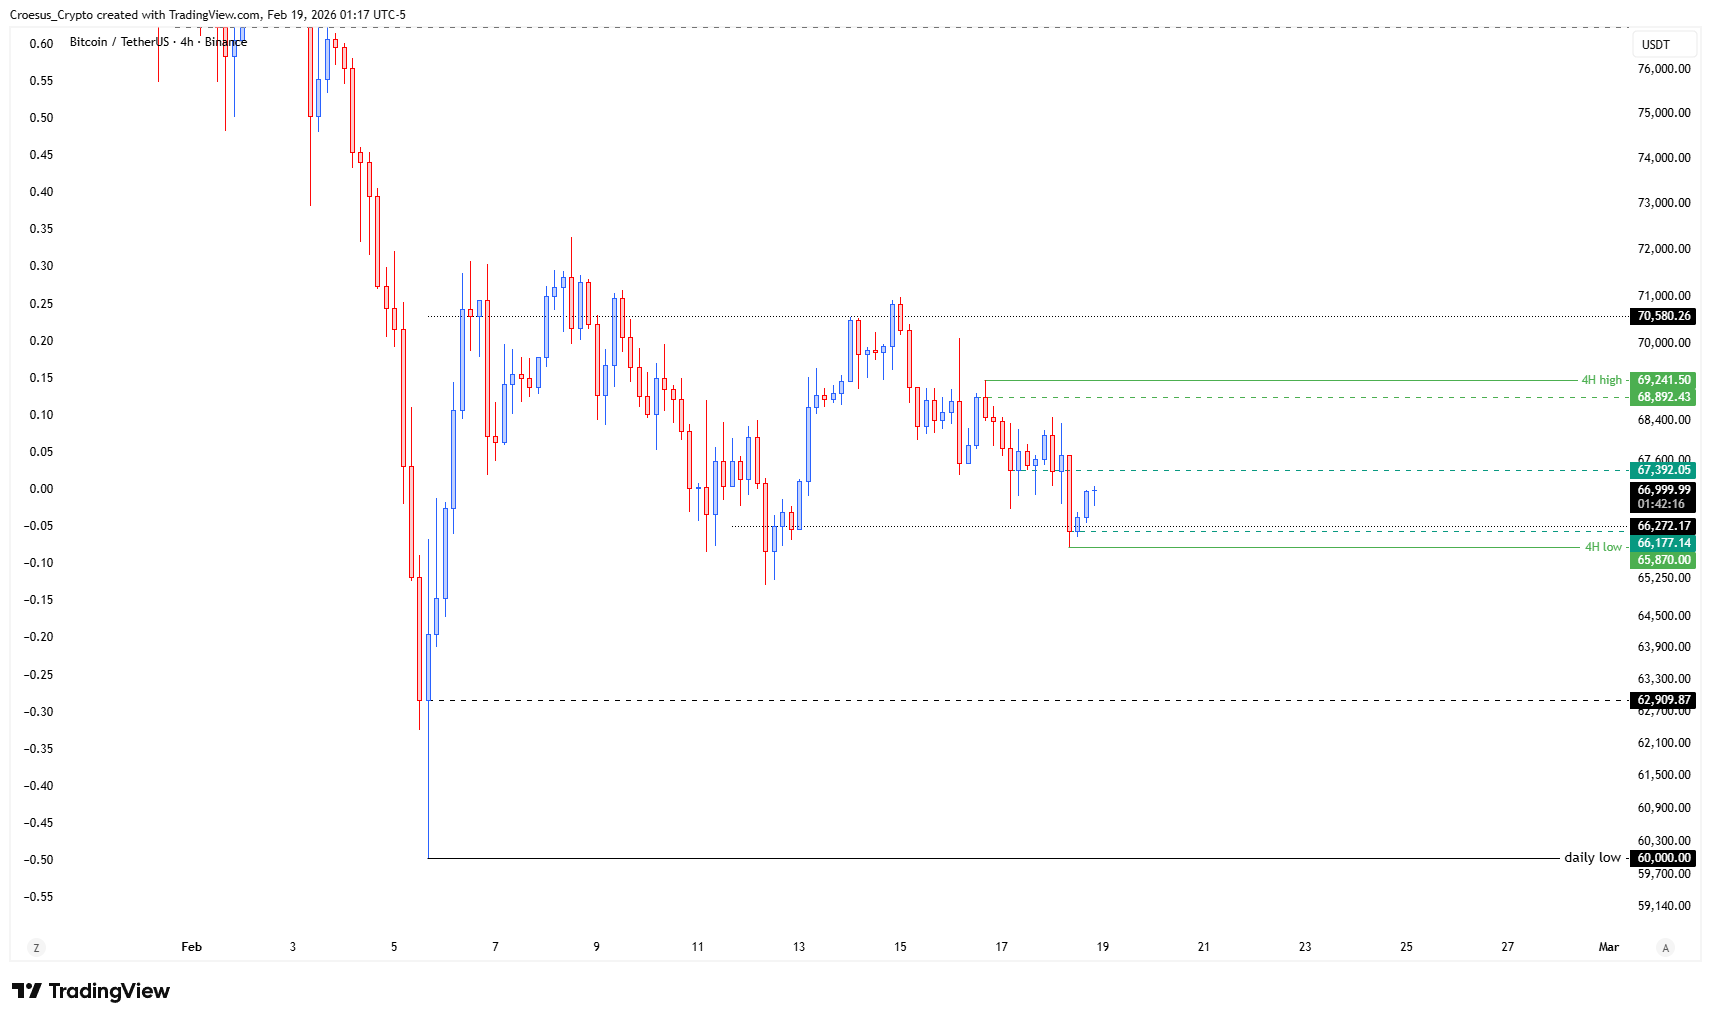
The dominant structure on the BTC daily chart is a sharp impulsive leg down into the 60k–63k region, followed by a sideways range. Price bounced off the 60k daily low and is now oscillating between support around 66k and resistance near 70.5k.
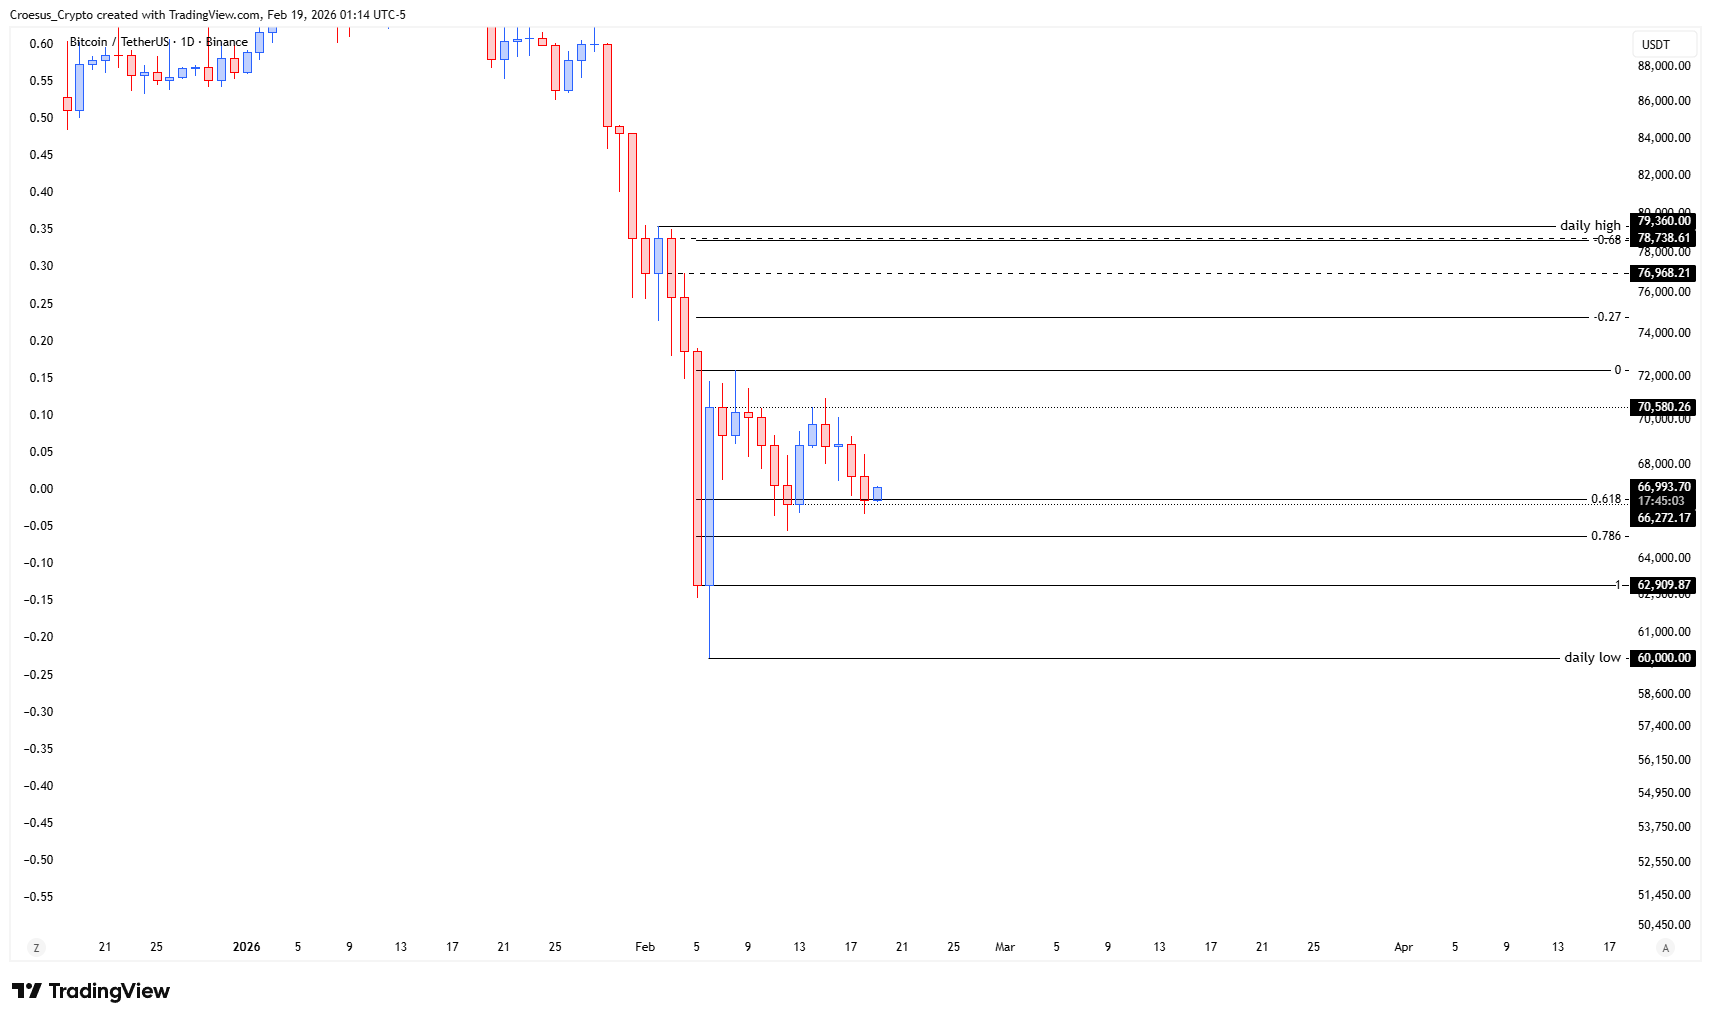
This range sits within the lower part of the prior swing, with higher resistance stacked between 76k and the former daily high around 79k. Those levels line up with key Fibonacci retracement zones of the recent dump, making them an important upside target if buyers regain control. As long as BTC holds daily closes above roughly 66k, we can interpret this as a corrective base rather than confirmed continuation. A decisive daily close below 66k would expose 62.9k and then the 60k daily low as the next liquidity magnets.
Key Levels and Scenarios
Bullish scenario (corrective): BTC defends 66k on a daily basis, prints a higher low above that band, and reclaims 70.5k. That would open a move first toward 76k and then into the 78–79k resistance cluster, where we expect heavy supply and strong Fibonacci confluence.
Critical levels to watch:
- $60,000 – daily low and key downside invalidation level.
- $63,000 – intermediate support around the B low region.
- ~$70,500 – A-swing / range resistance; reclaim would strengthen the corrective rally.
- $76,000–79,000 – higher resistance cluster and potential C-leg completion zone, overlapping with Fibonacci projections.
Trading Implications
From a technical analysis standpoint, any long positioning here is a tactical play within a correction: traders may look for entries near support with tight stops below 60,000 or wait for confirmed closes above 70,500, keeping position sizes modest due to the strong preceding downtrend and respecting all marked support resistance levels.
This analysis is for informational purposes only and does not constitute financial advice.