BTC Marketcap / Bitcoin
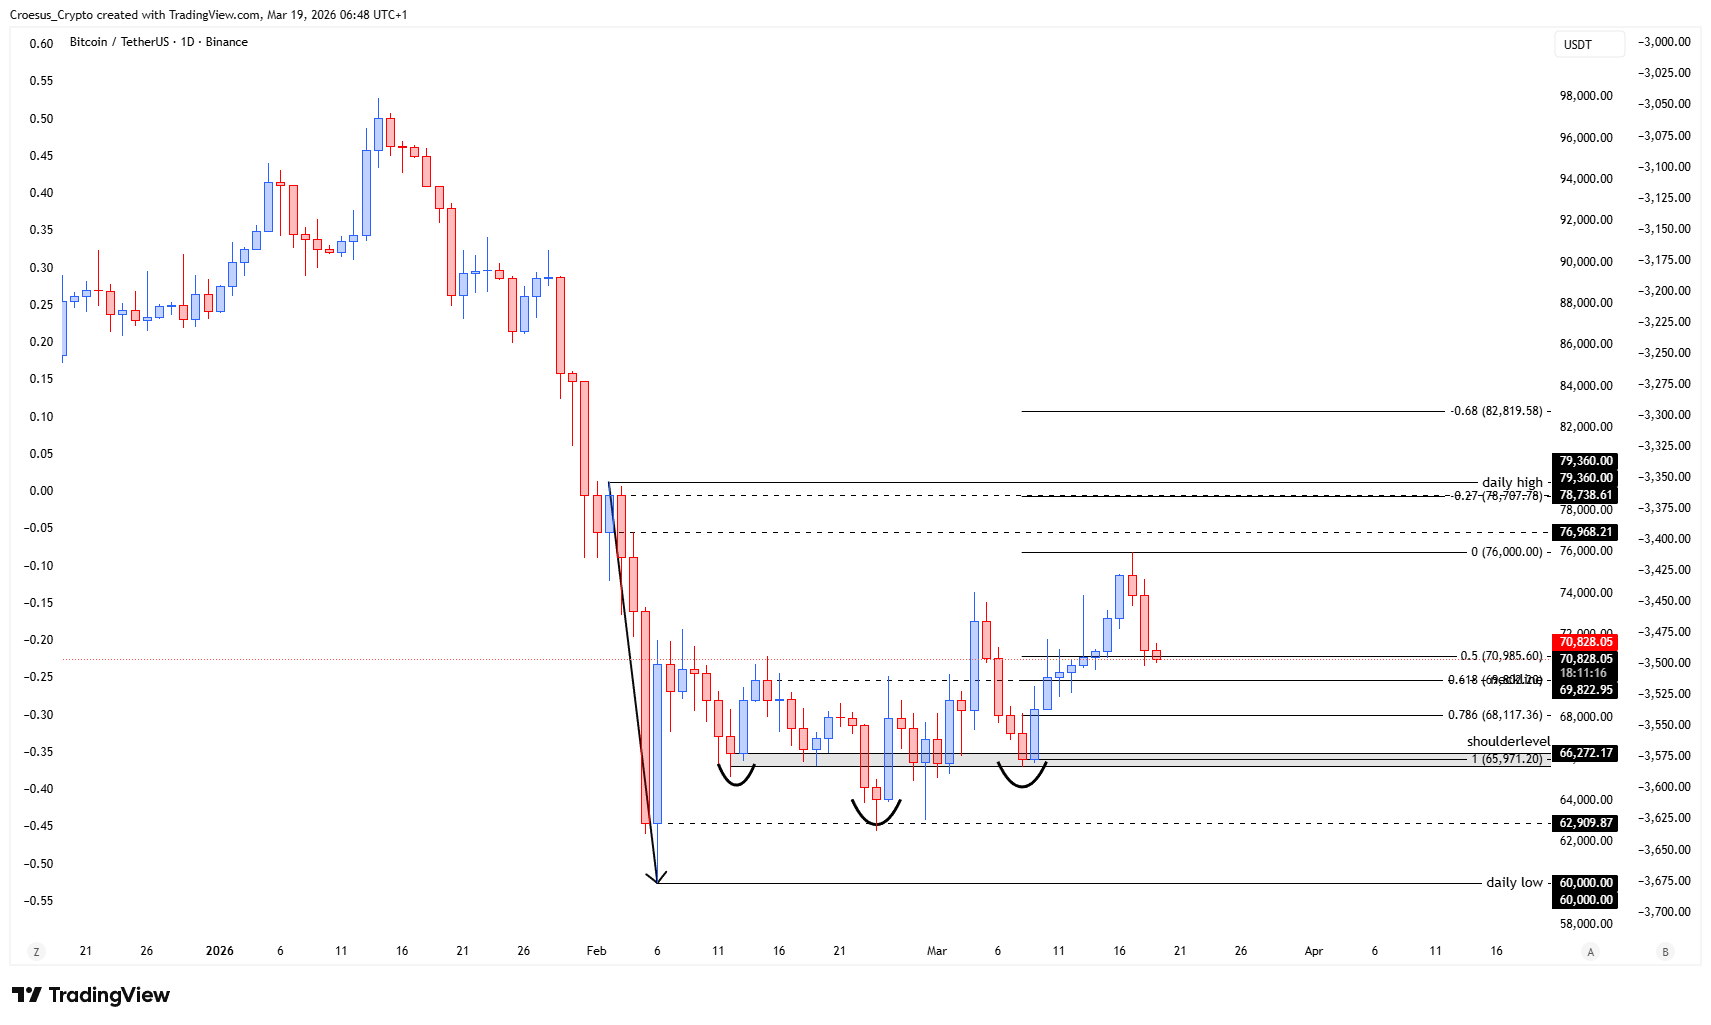
BTC daily analysis 18/03/2026. Bitcoin is trading in a bearish context after a clear rejection, with sellers confirming control and price rotating back toward a key Fibonacci confluence zone.
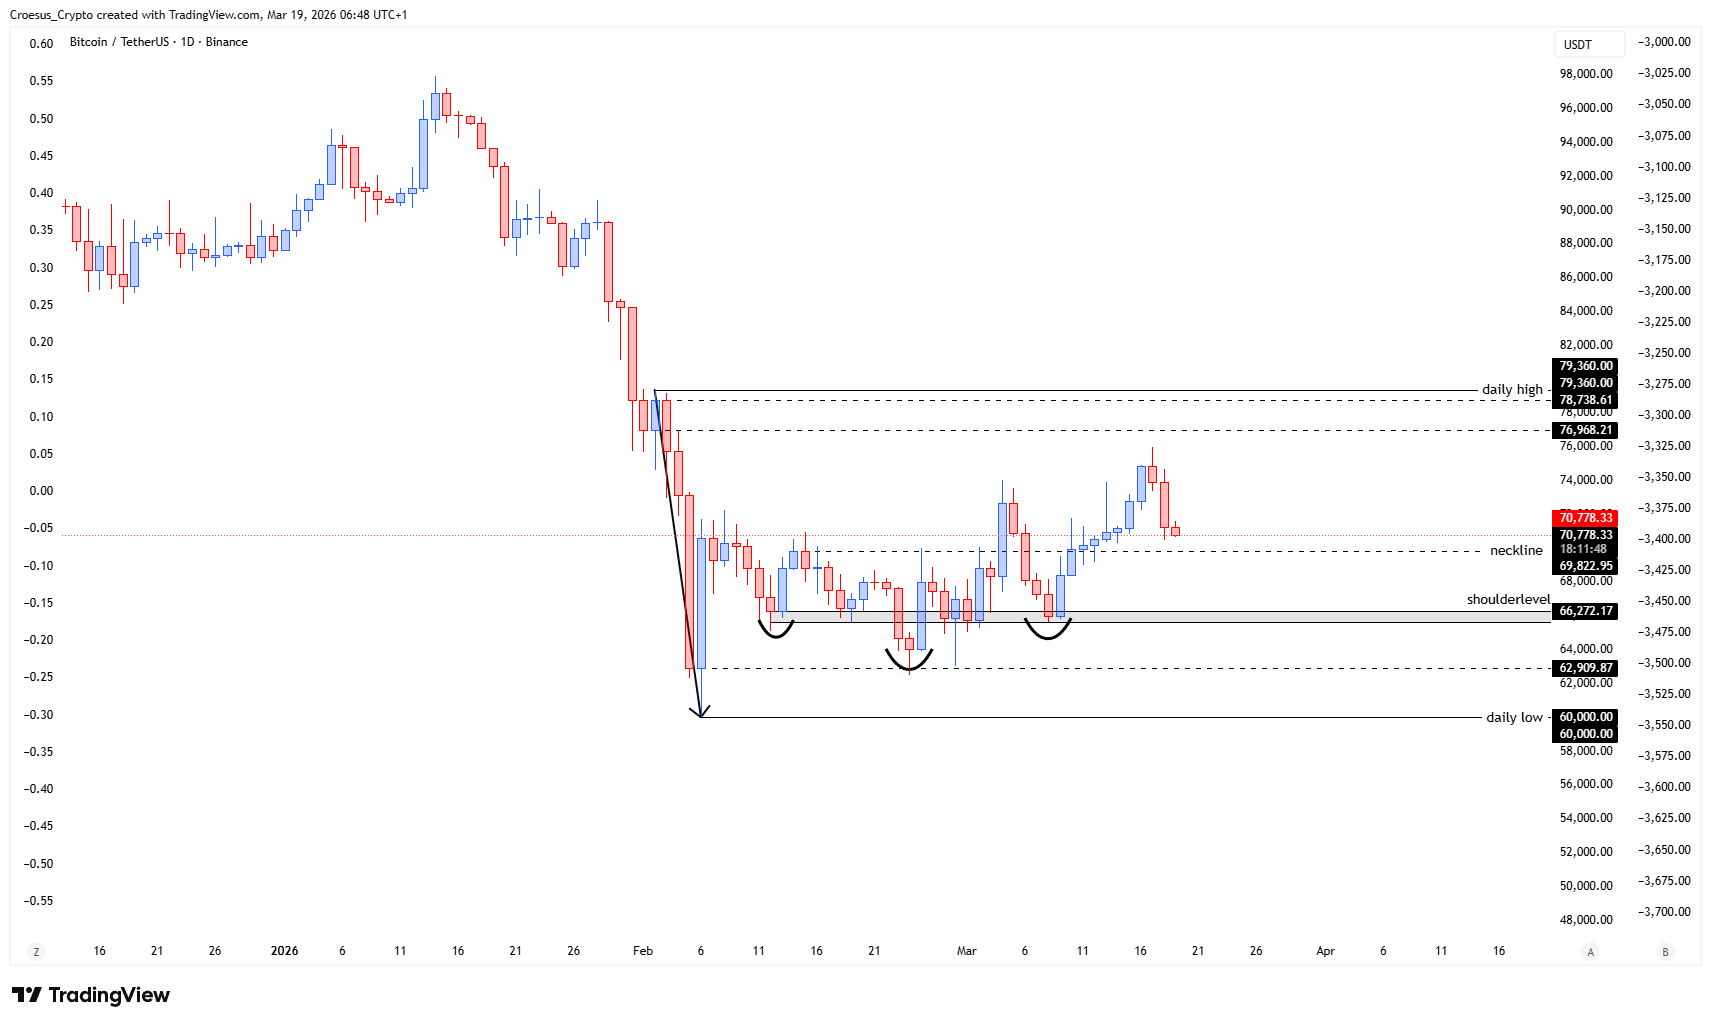
- The BTC price was stopped and after showing us a first bearish indicational candle, the price confirmed.
- If we take the Fibonacci retracement from the last leg up, we can clearly see the neckline aligning with the fib 0.618 and the daily high with the -0.27.
- Price approaching the golden pocket.
Market Structure Analysis
This BTC daily analysis highlights a clean shift in short-term market structure: price was halted at a key overhead zone, printed an initial bearish signal candle, and then followed through with confirmation. That sequence typically reflects a failed continuation attempt and a rotation back into prior support resistance.
The key technical element is the Fibonacci retracement taken from the last leg up, where the neckline area aligns with the 0.618 retracement, adding confluence to that level. With price now approaching the golden pocket zone, our focus stays on whether the move develops as a controlled corrective pullback into support, or whether sellers push through that confluence and expand the bearish impulse.
Key Levels and Scenarios
Bearish continuation is favored while price remains accepted below the recent stopping point, with the 0.618 neckline confluence acting as the main decision area. A clean hold and rejection from that zone can sustain the down move, while strong acceptance back above the neckline would weaken the bearish structure and suggest a deeper recovery attempt.
- Neckline zone (confluence area) as the primary support resistance decision level
- Fibonacci 0.618 retracement aligning with the neckline (key confluence for reaction)
- Daily high area referenced by the Fibonacci -0.27 (recent swing reference for invalidation context)
- Golden pocket area as the near-term magnet zone for price interaction
This analysis is for informational purposes only and does not constitute financial advice.