


BTC Marketcap / Bitcoin
BTC daily analysis 18/05/2026. Bitcoin is still positioned in a broader bearish context, but our BTC daily analysis highlights that the most recent downside leg is losing momentum and buyers are starting to respond at current support.
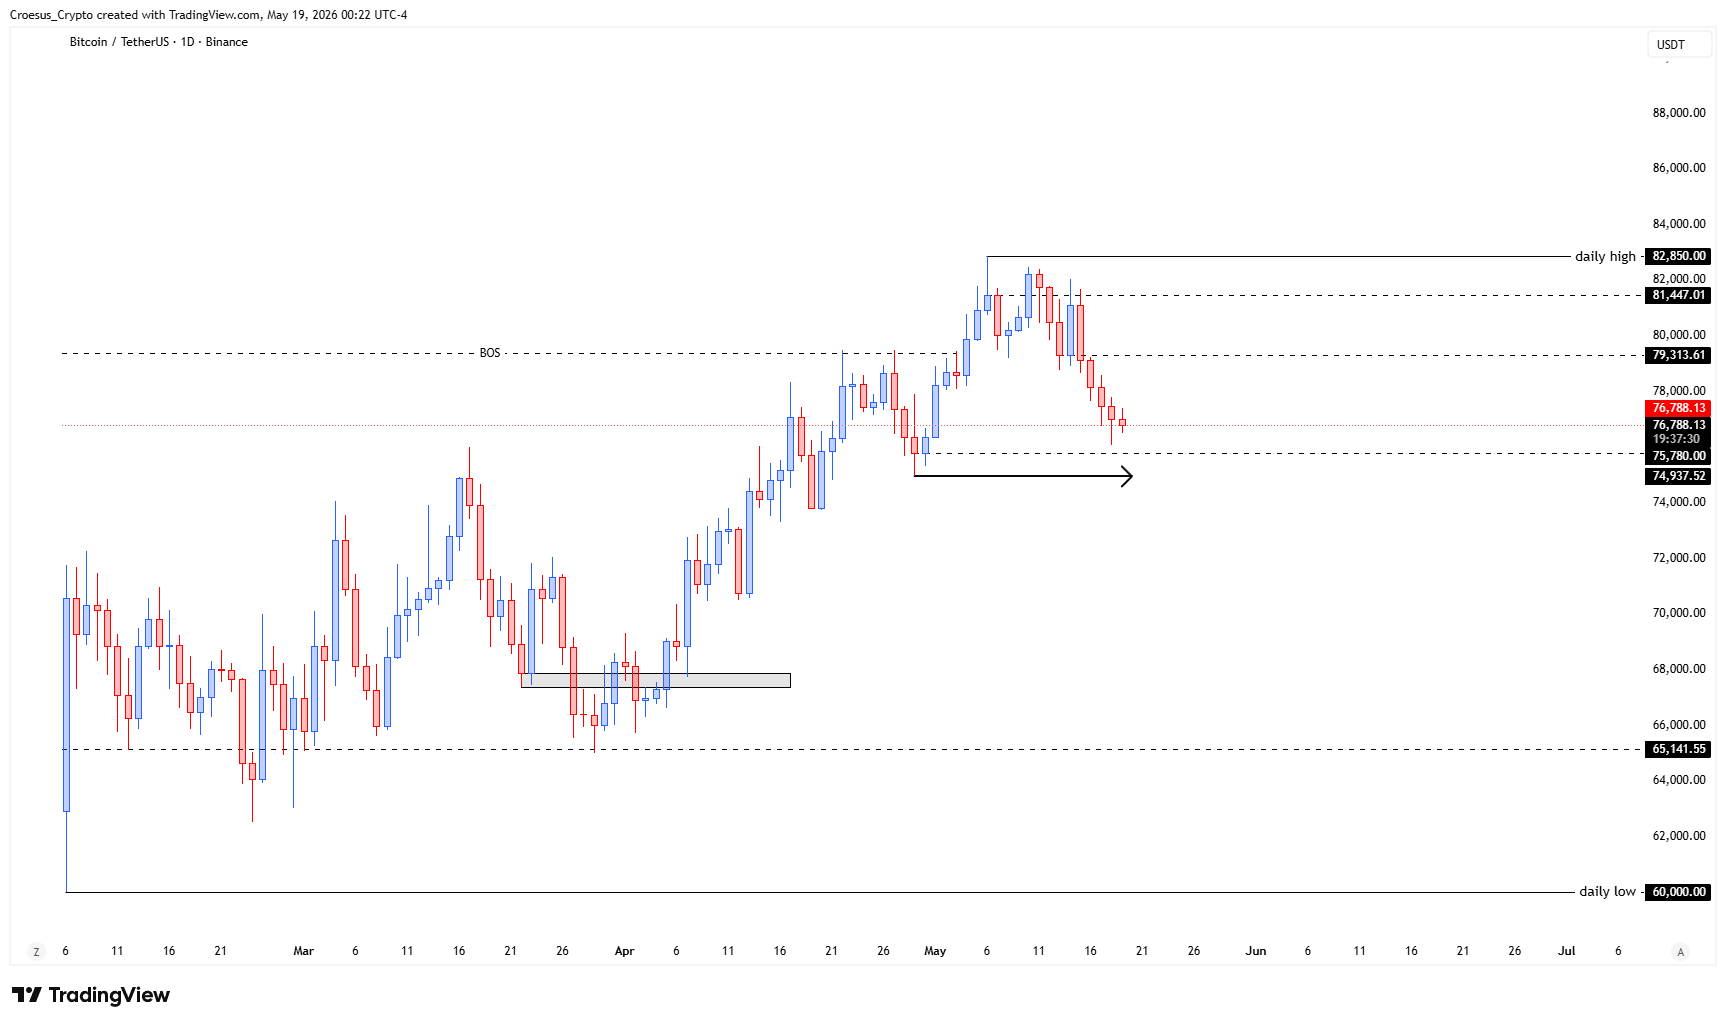
- BTC's price shows us that, after the reversal pattern (head and shoulders) and the following push down, the leg down is now fading.
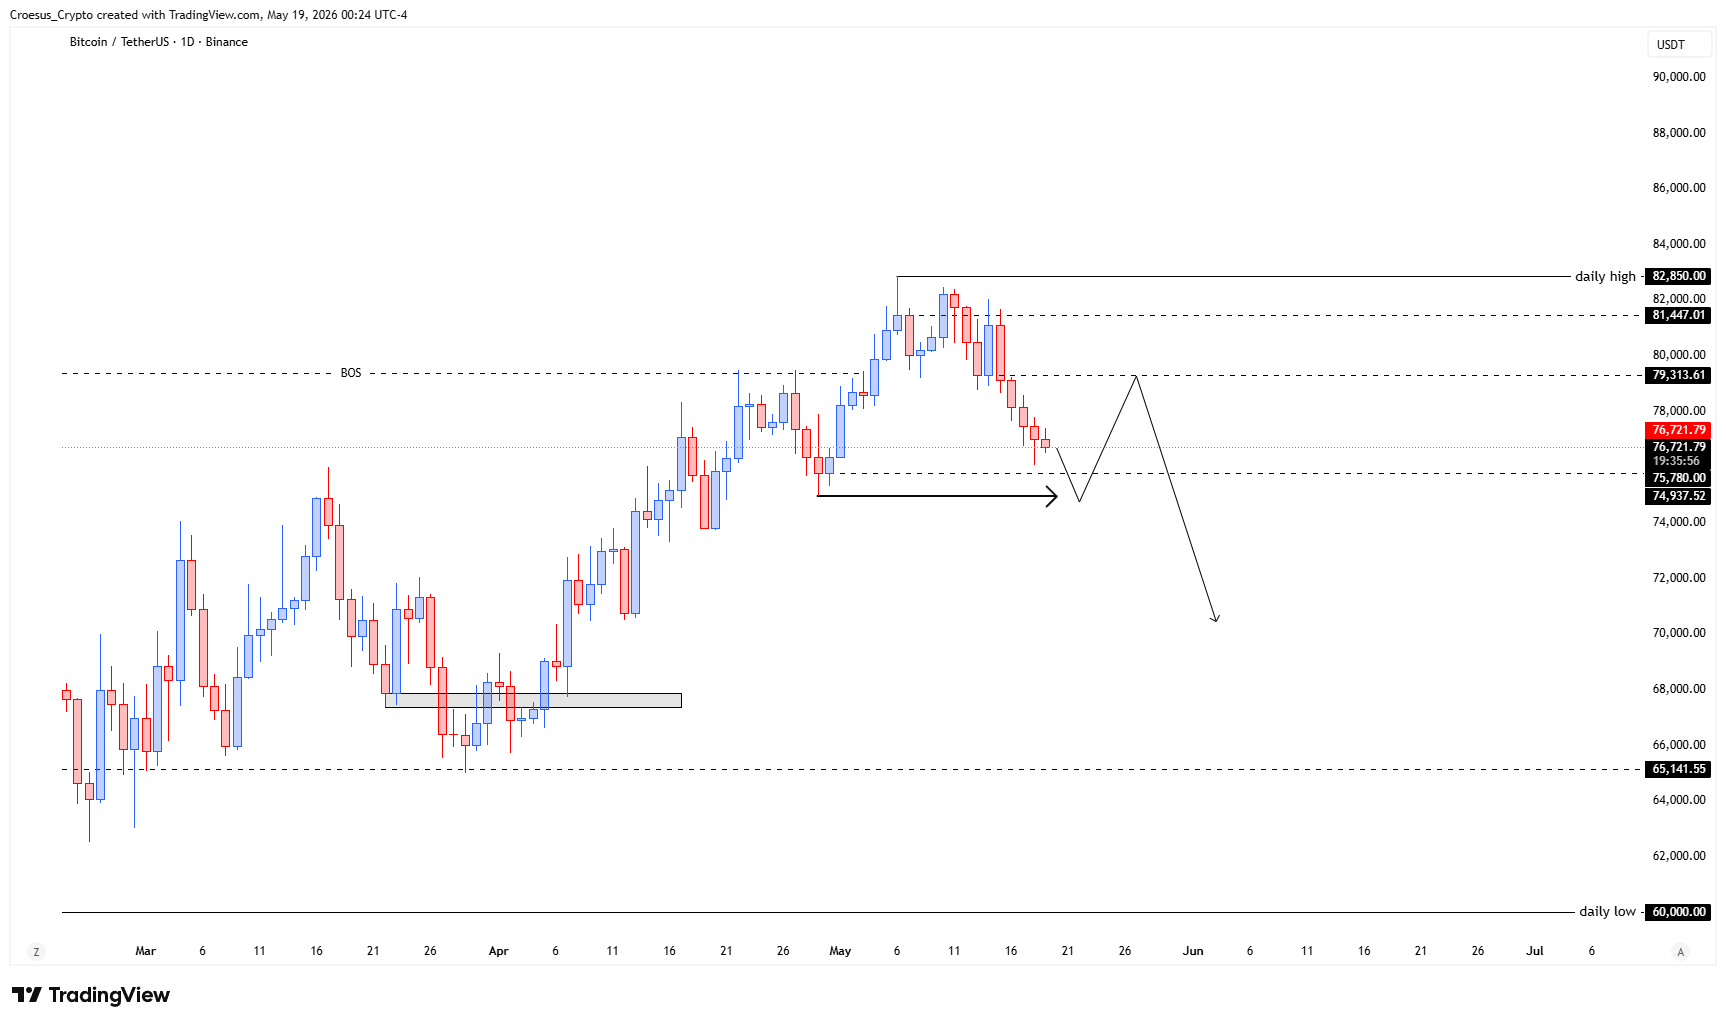
- This shows us that bulls are willing to defend this level and push back up. Most likely after a sweep of the nearby prior swing low.
- This frames still in a higher timeframe set-up on the weekly : a bullish correction of a larger bearish impulse, until proven otherwise.
- This first break of a daily high could be leg 1, the actual relief could be leg 2 and we might expect a leg 3 to finish the larger bullish correction on the weekly time frame
- But if the bulls are really lacking power and there is no more will to defend, price could collapse and we could see a bearish continuation below the 60K.
Market Structure Analysis
The head and shoulders reversal and subsequent push down define the dominant bearish impulse, but the current “fading” downside leg suggests sellers are no longer printing clean continuation. Structurally, that often precedes a corrective rotation: price compresses near a local support zone, then attempts to reclaim prior intraday structure. The mention of a potential sweep of the nearby prior swing low is key—this type of liquidity grab can mark a short-term terminal move before relief. In that context, the first break of a daily high becomes an early signal of a shift in short-term order flow, while the weekly view remains a bullish correction inside a larger bearish impulse (until a clearer weekly break of structure confirms otherwise).
Key Levels and Scenarios
For this BTC daily analysis, the bullish corrective path requires bulls to keep defending the current base after any swing-low sweep and to continue building above reclaimed daily structure. The bearish continuation scenario remains active if support fails and price accepts below the key psychological zone.
- $60K as the key bearish continuation trigger if acceptance occurs below it
- Nearby prior swing low as the liquidity zone that could be swept before relief
- First broken daily high as the initial reclaim level that supports a multi-leg correction thesis
- Current defense area as the immediate support resistance battleground for short-term control
Trading Implications
Aggressive participants typically focus on the intraday structure shift (daily high breaks and reclaim behavior), while conservative participants generally wait for clearer confirmation that the weekly correction is extending. Risk remains elevated while price sits near a potential liquidity sweep zone and the broader trend is still bearish.
This analysis is for informational purposes only and does not constitute financial advice.