


BTC Marketcap / Bitcoin
In this BTC daily analysis for 19 February 2026, we see Bitcoin stabilising after a strong impulsive selloff, trading in a tight range above the recent daily low while respecting prior support resistance areas and Fibonacci retracement levels. The market is clearly in a corrective phase, and the next move out of this range should define short-term direction.
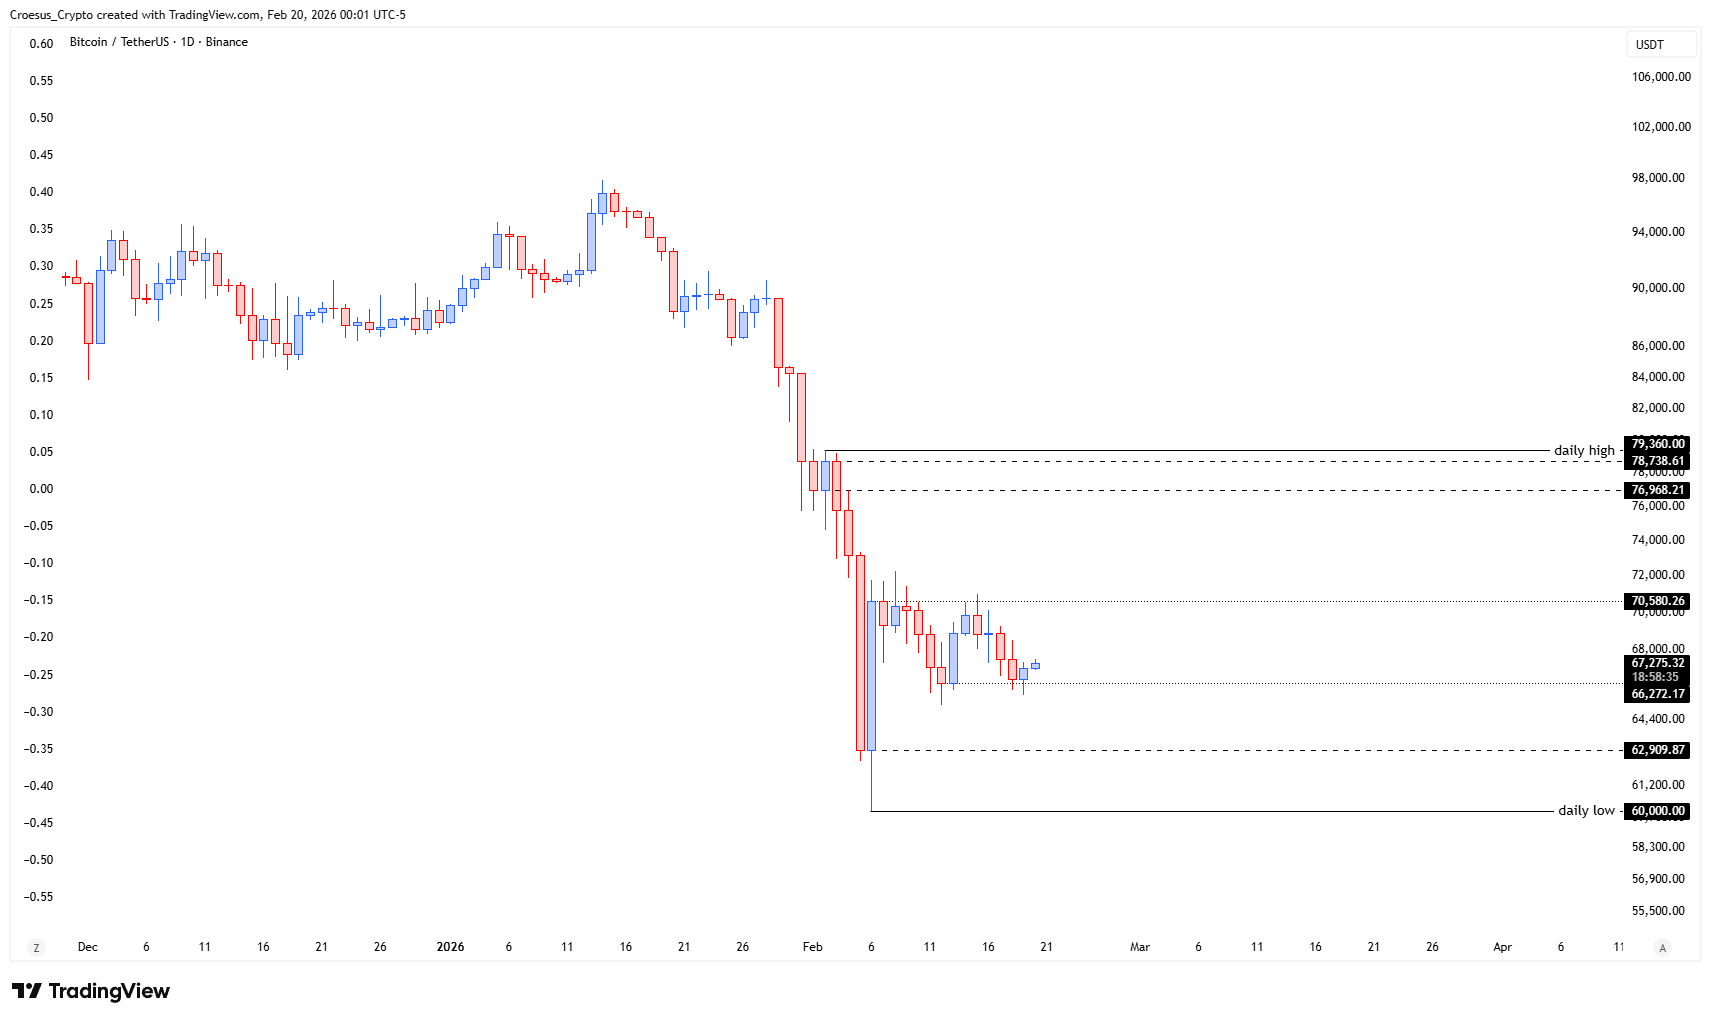
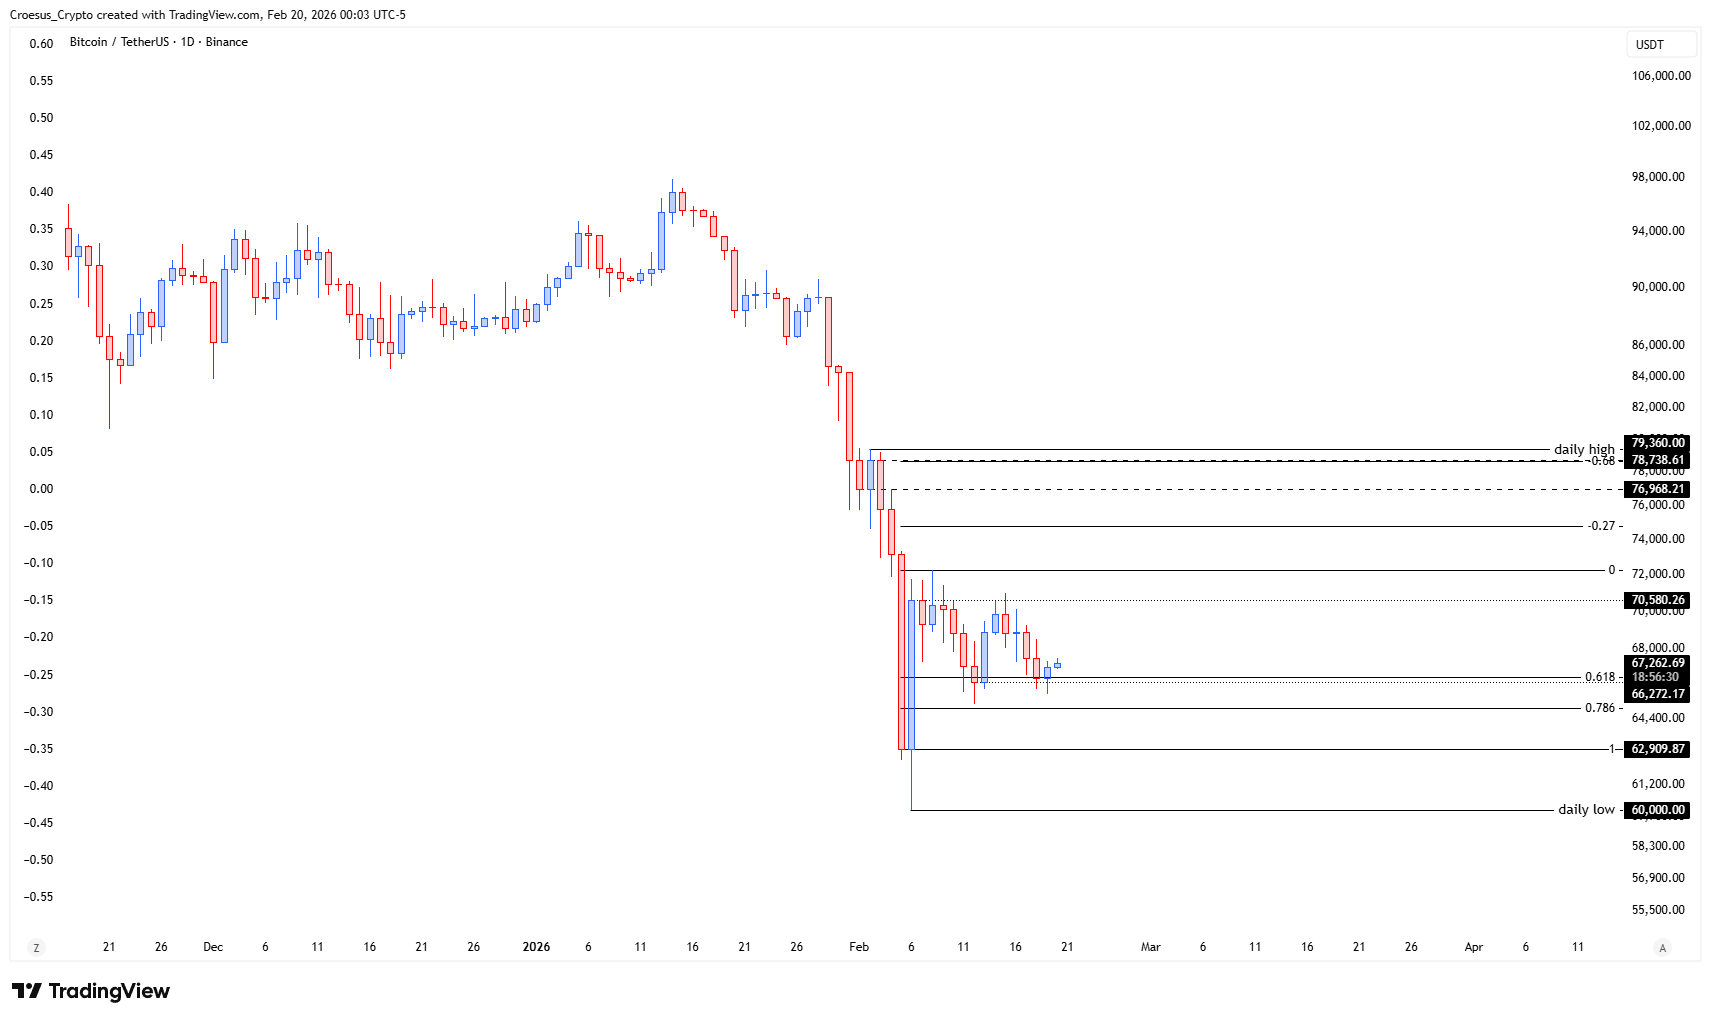
- same as with TOTAL : will this level hold as support or will we see a retest lower towards the daily low ?
- ABC-correction remains in play
Market Structure Analysis
Our technical analysis frames the recent price action as an impulsive leg down followed by an evolving ABC correction. BTC bounced from the daily low and is now moving sideways with lower volatility, typical for a mid-correction phase.
As long as candles close above the current base, we can treat this level as temporary support; however, repeated failures to break higher keep the door open for a deeper test of the low. The overhead band around the previous breakdown zone and Fibonacci retracements acts as resistance and will need to be reclaimed to signal that the correction is maturing.
Key Levels and Scenarios
Bullish scenario:
If buyers defend current support and push BTC through the local corrective highs, BTC daily analysis points to a continuation of the ABC structure toward the prior daily high region and key resistance cluster.
Critical levels to watch:
- $60,000 – daily low and key downside invalidation level.
- $63,000 – intermediate support around the B low region.
- ~$70,500 – A-swing / range resistance; reclaim would strengthen the corrective rally.
- $76,000–79,000 – higher resistance cluster and potential C-leg completion zone, overlapping with Fibonacci projections.
Trading Implications
For active traders, positioning near support demands tight risk control, while conservative participants may wait for a confirmed breakout above range highs before committing size, keeping position sizing modest until the correction resolves.
This analysis is for informational purposes only and does not constitute financial advice.