


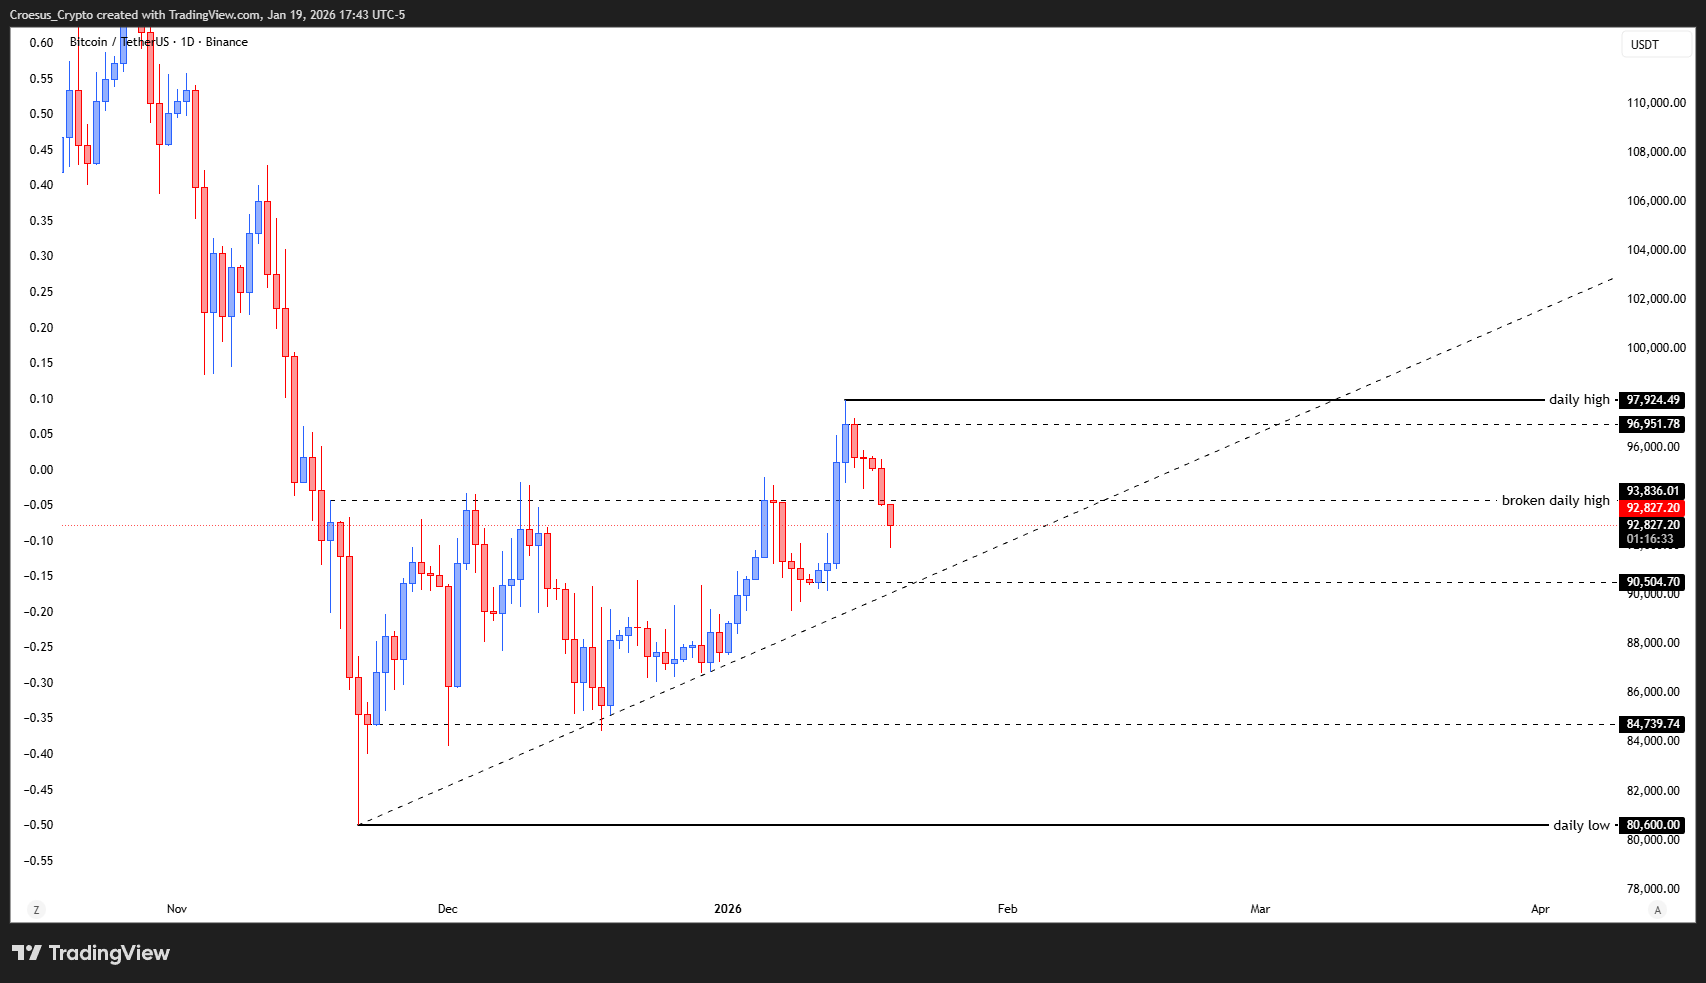
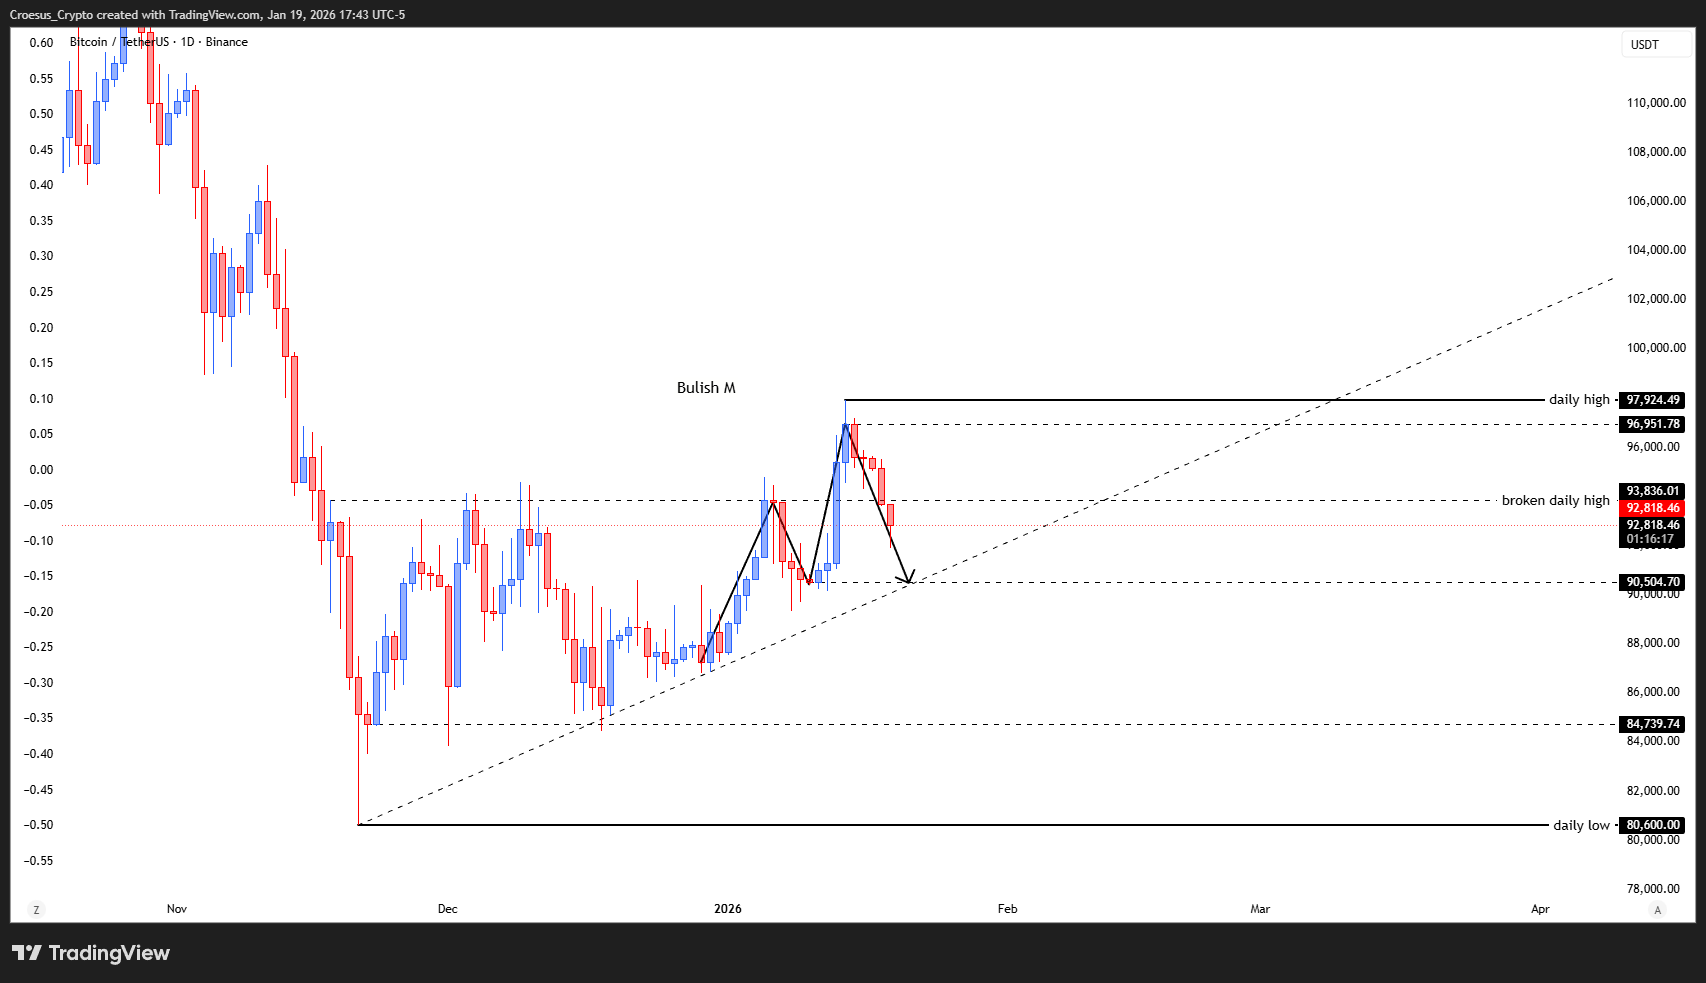
In this BTC daily analysis for January 2026 we see Bitcoin following the same structure as the TOTAL index: a recent breakout above the prior range has failed for now, with price slipping back below the broken daily high and retracing toward the rising trendline. Our technical analysis focuses on whether this pullback evolves into a healthy correction within a bullish M, or the start of a deeper reversal pattern.
TC daily analysis chart 19 Jan 2026 with rising trendline, broken daily high and projected corrective path toward 90.5k–84.7k support.
Technical Analysis Key Points
- just as with the TOTAL chart we can see the price move back below the broken daily high, falling back into the prior daily range.
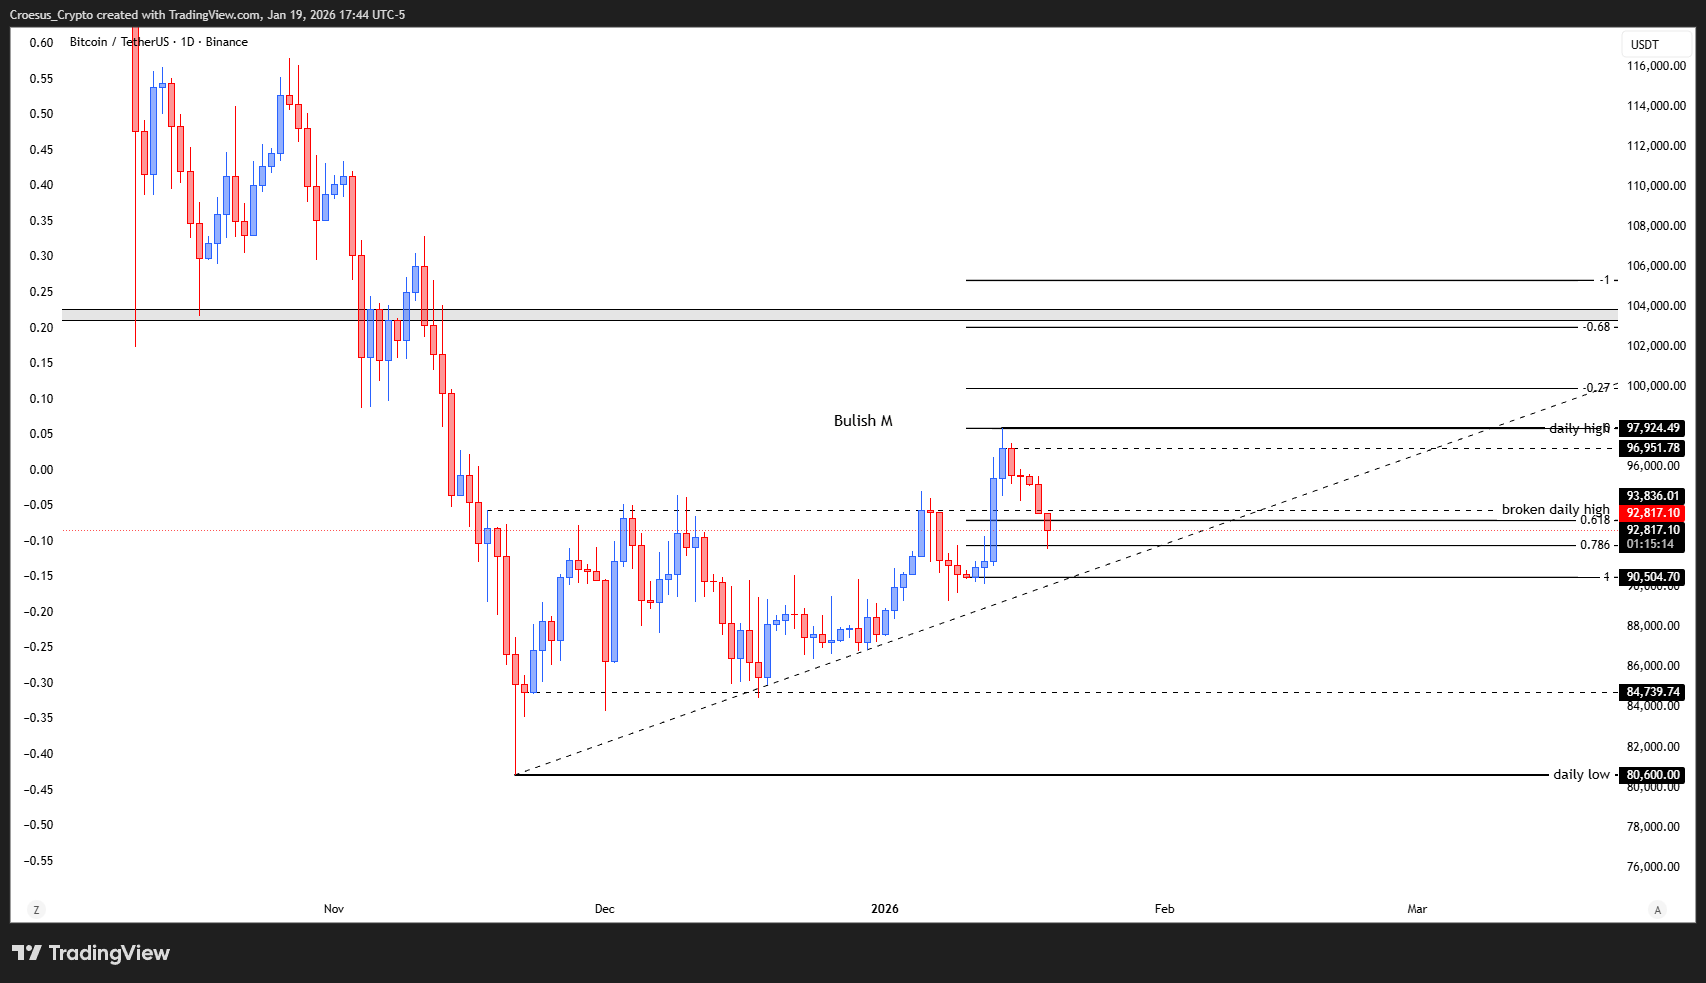
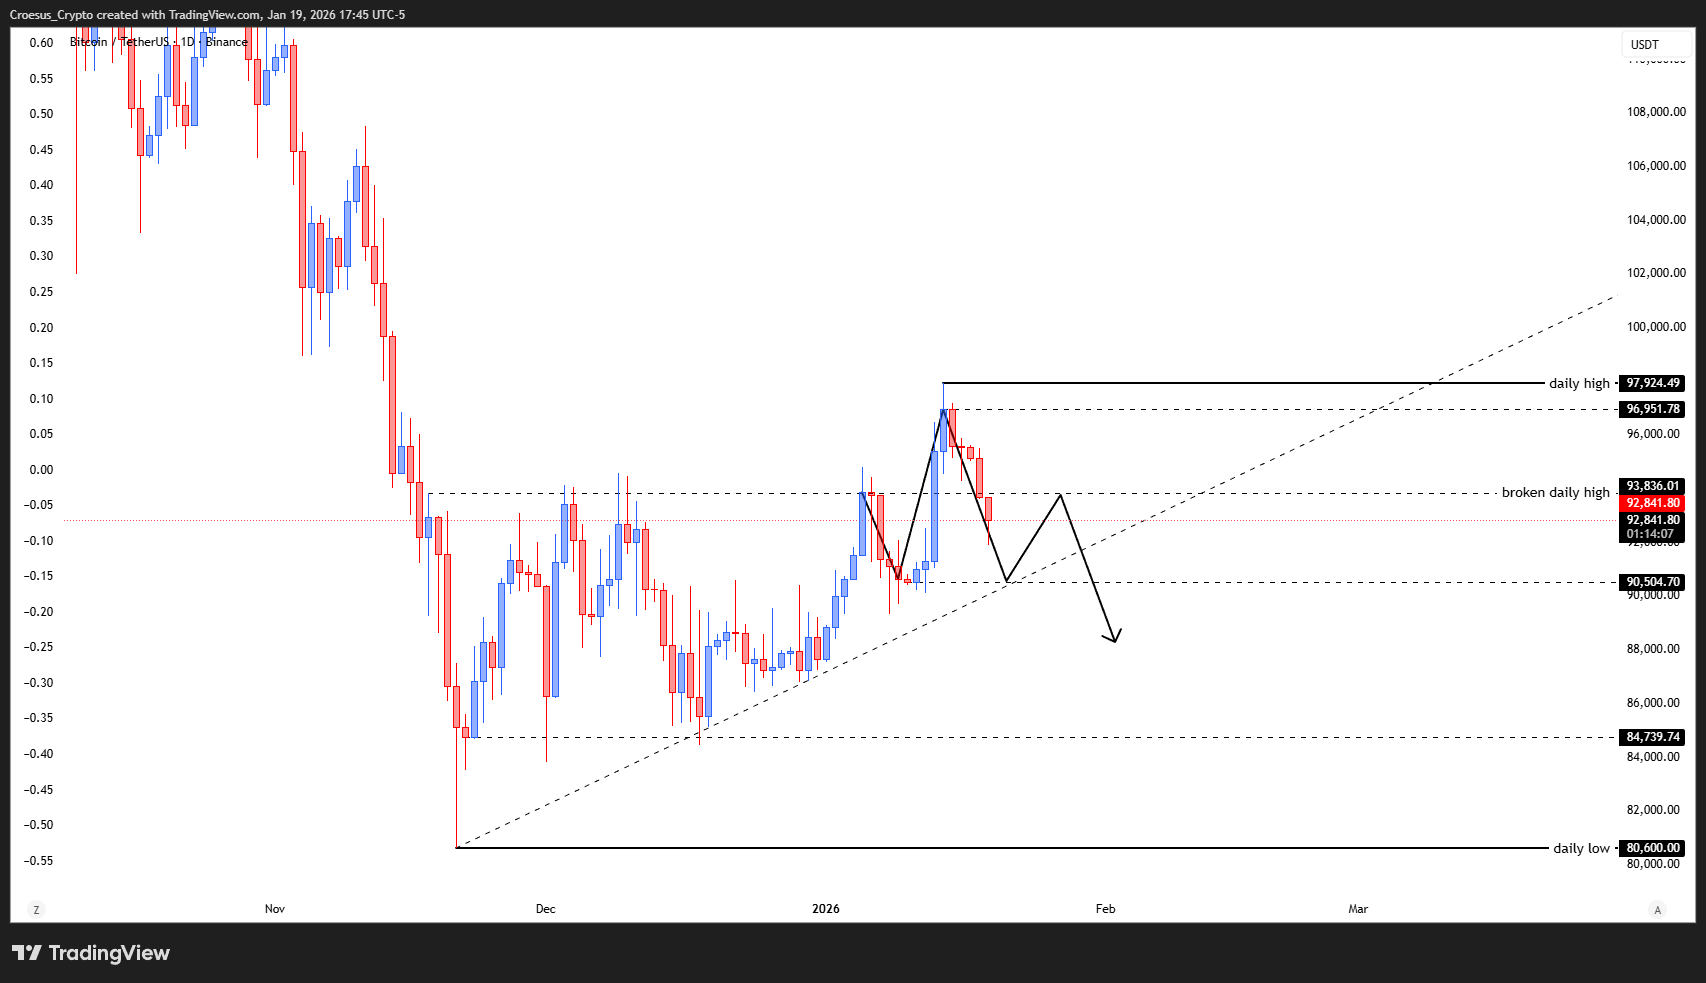
- we can also see here the same two set-ups as with the TOTAL.
Market Structure Analysis
Structurally, BTC remains in an uptrend with higher lows respecting the ascending trendline from the 80,600 USDT daily low. The rejection from the 97,924 USDT daily high triggered a corrective leg that drove price back under the broken daily high around 93,800 USDT, bringing it again inside the former consolidation range.
As with our TOTAL daily analysis, we track two main set-ups.
On the bullish side, the prior leg formed a clear bullish M with a strong impulse, and a Fibonacci retracement into the 90,500 USDT zone and the trendline could simply reset momentum while keeping the broader move higher intact.
On the bearish side, failure to reclaim the broken daily high could open the door for a developing head & shoulders or broader distribution beneath resistance.
Key Levels and Scenarios
Bullish scenario:
A controlled pullback into 90,500 USDT and/or the trendline, followed by a higher low and reclaim of 93,800 USDT, would keep BTC daily analysis bullish and potentially target 96,950–97,924 USDT and higher Fibonacci extension levels.
Key levels to watch
97,924 USDT – Current daily high / main resistance.
96,950 USDT – Local resistance, part of upper supply band.
93,800 USDT – Broken daily high; key support/resistance flip.
90,500 USDT – First major support and possible reaction zone.
84,739–80,600 USDT – Deeper support band; loss of this would damage the bullish structure.
Trading Implications
Given the mixed signals between bullish M structure and potential topping, we see an asymmetric environment where traders should treat the 93,800 USDT area as a critical support resistance pivot and size positions conservatively until a clear reclaim or breakdown confirms direction.
This is not financial advice; always do your own research and manage your risk appropriately.