


BTC remains bearish after rejecting the monthly liquidity zone and sweeping the daily low. Reclaim noted, but no confirmation yet; trend stays bearish below 96.8K.
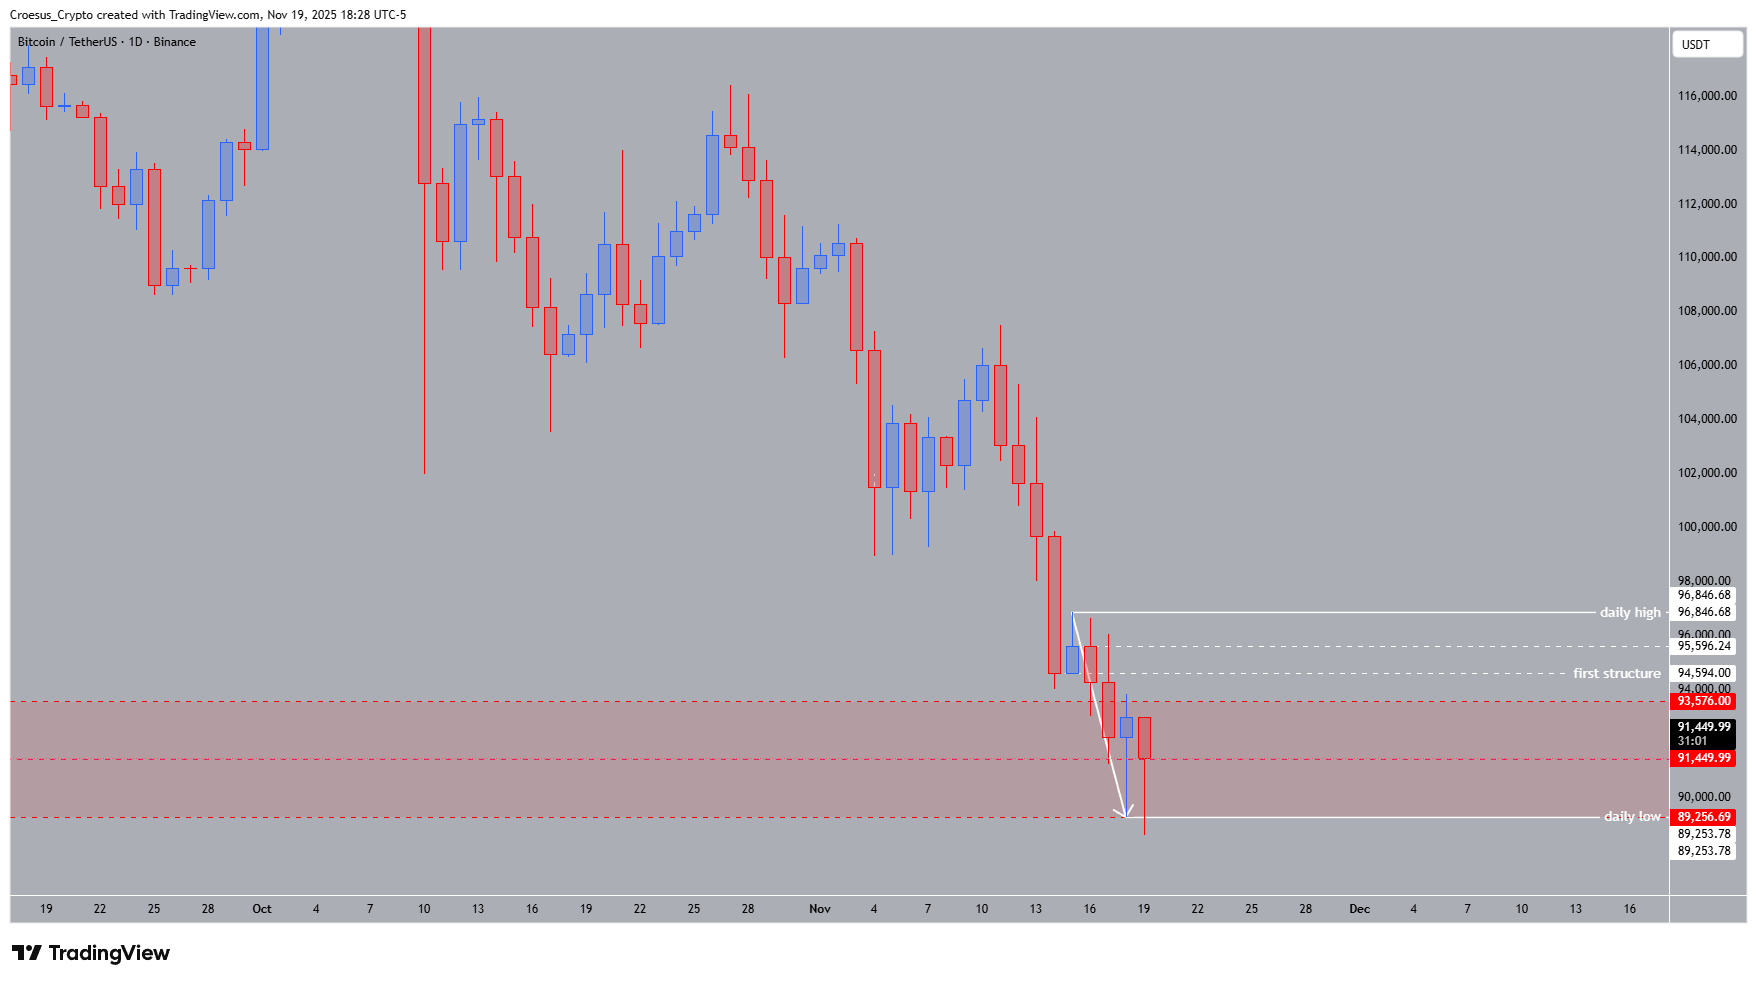
- Trend = bearish ↓
- Daily high =96.846,68$
- Daily low = 89.253,78 $
- Technical Analysis Key Points
- After being rejected at the high of the monthly liquidity zone and impulsively retesting the low of that same zone, the price retested and swept the daily low and the low of the monthly liquidity zone structural
- At the end price was bought up nicely, closing around the equilibrium of the monthly liquidity zone.
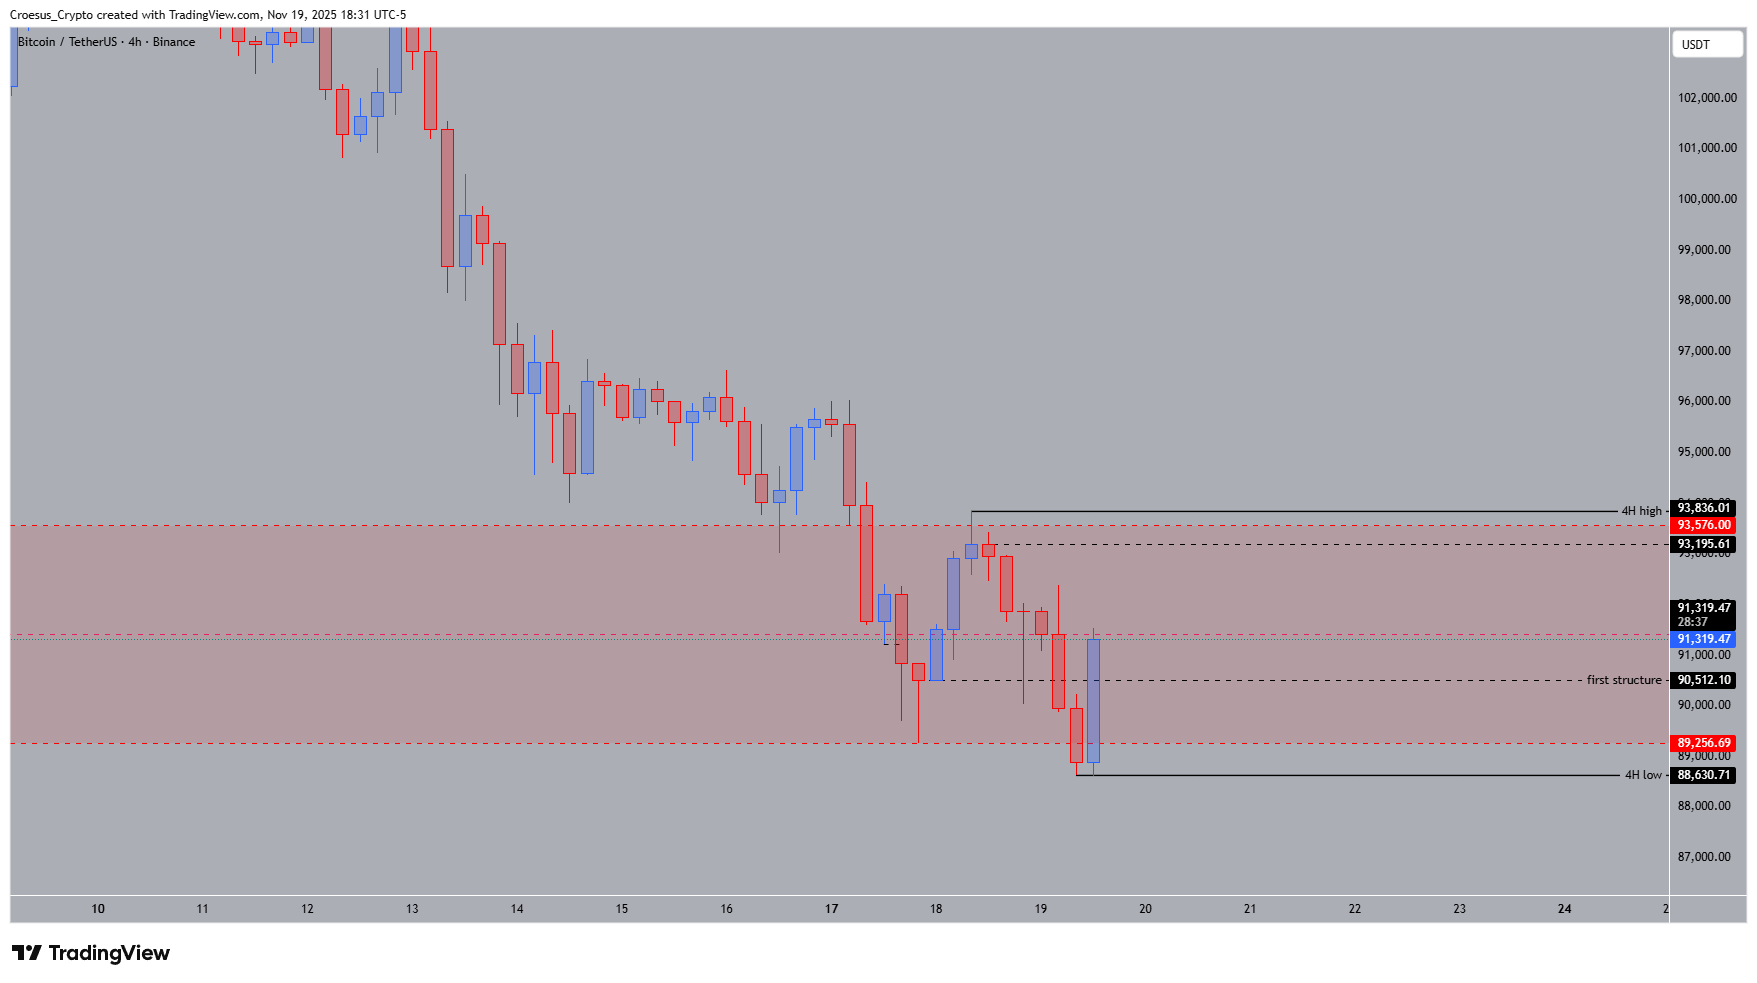
- If we zoom in on the 4H timeframe, we can see that the price remains bearish, printing a new lower low.
- Price dipped shortly below the low of the monthly liquidity zone, but was reclaimed on the following candle, finishing the day with a nice bullish candle. But still no confirmation.
- Patience remains key !
Market Structure Analysis
BTC continues to trade within a clear bearish structure on the daily timeframe. After rejecting the upper boundary of the monthly liquidity zone, price delivered an impulsive decline that swept the 89.25K daily low and the structural low of the monthly liquidity range. Although liquidity was collected, BTC closed the session near the zone’s equilibrium, indicating buyer presence but not a structural reversal.
On the 4H chart, the market maintains a firm downtrend with yet another lower low confirming bearish continuation. The brief dip below the monthly liquidity zone was reclaimed, forming a bullish candle into the daily close. However, this reaction reflects absorption, not confirmation. Without a break of the daily high at 96.846K, the bearish bias remains intact.
The lack of a clear momentum shift—especially after a multi-week decline—reinforces the need for caution. Bulls must reclaim structure; until then, lower-timeframe bullish candles should be treated as corrective rather than trend-changing.
Key Levels and Scenarios
Bullish scenario (requires confirmation)
A structural reversal only triggers with a daily break and close above 96,846.68 USD, opening space toward the 98K–100K region (+2–4%) and potentially signaling a higher-timeframe rotation.
Critical Levels to Watch
96,846 USD – Daily high: Break of structure required
94,594 USD – First structure: Mid-zone resistance on any bounce
93,576 USD – Local range ceiling: Barrier capping intraday upside
91,449 USD – Mid-liquidity support: Must hold to avoid full retest
89,253 USD – Daily low: Key liquidity sweep level
Trading Implications
The trend remains bearish; traders should wait for a confirmed daily structure break before shifting bias. Any bullish setups remain speculative below 96.8K.
This analysis is for educational purposes only and not financial advice.