BTC Marketcap / Bitcoin
BTC daily analysis 19/03/2026. Bitcoin is printing a short-term relief move inside a broader bearish context, with price interacting with a key neckline zone that currently defines the immediate support resistance battle.
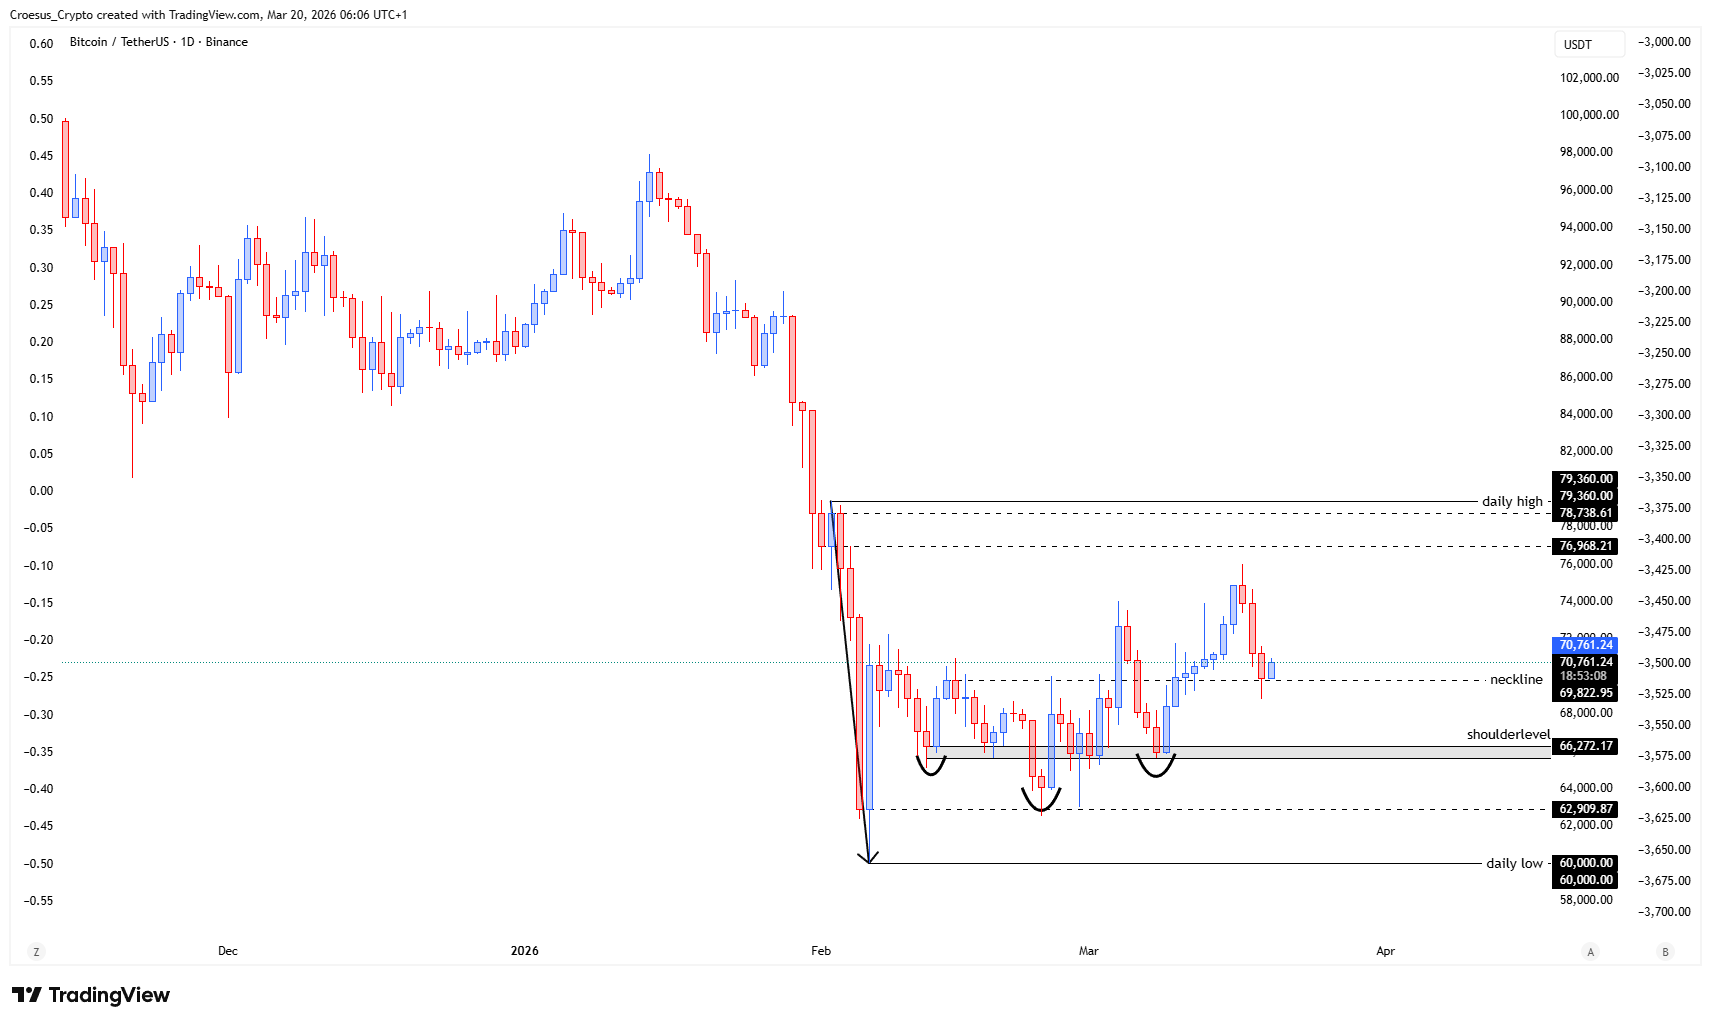
- The BTC price showed some relief, retesting the neckline.
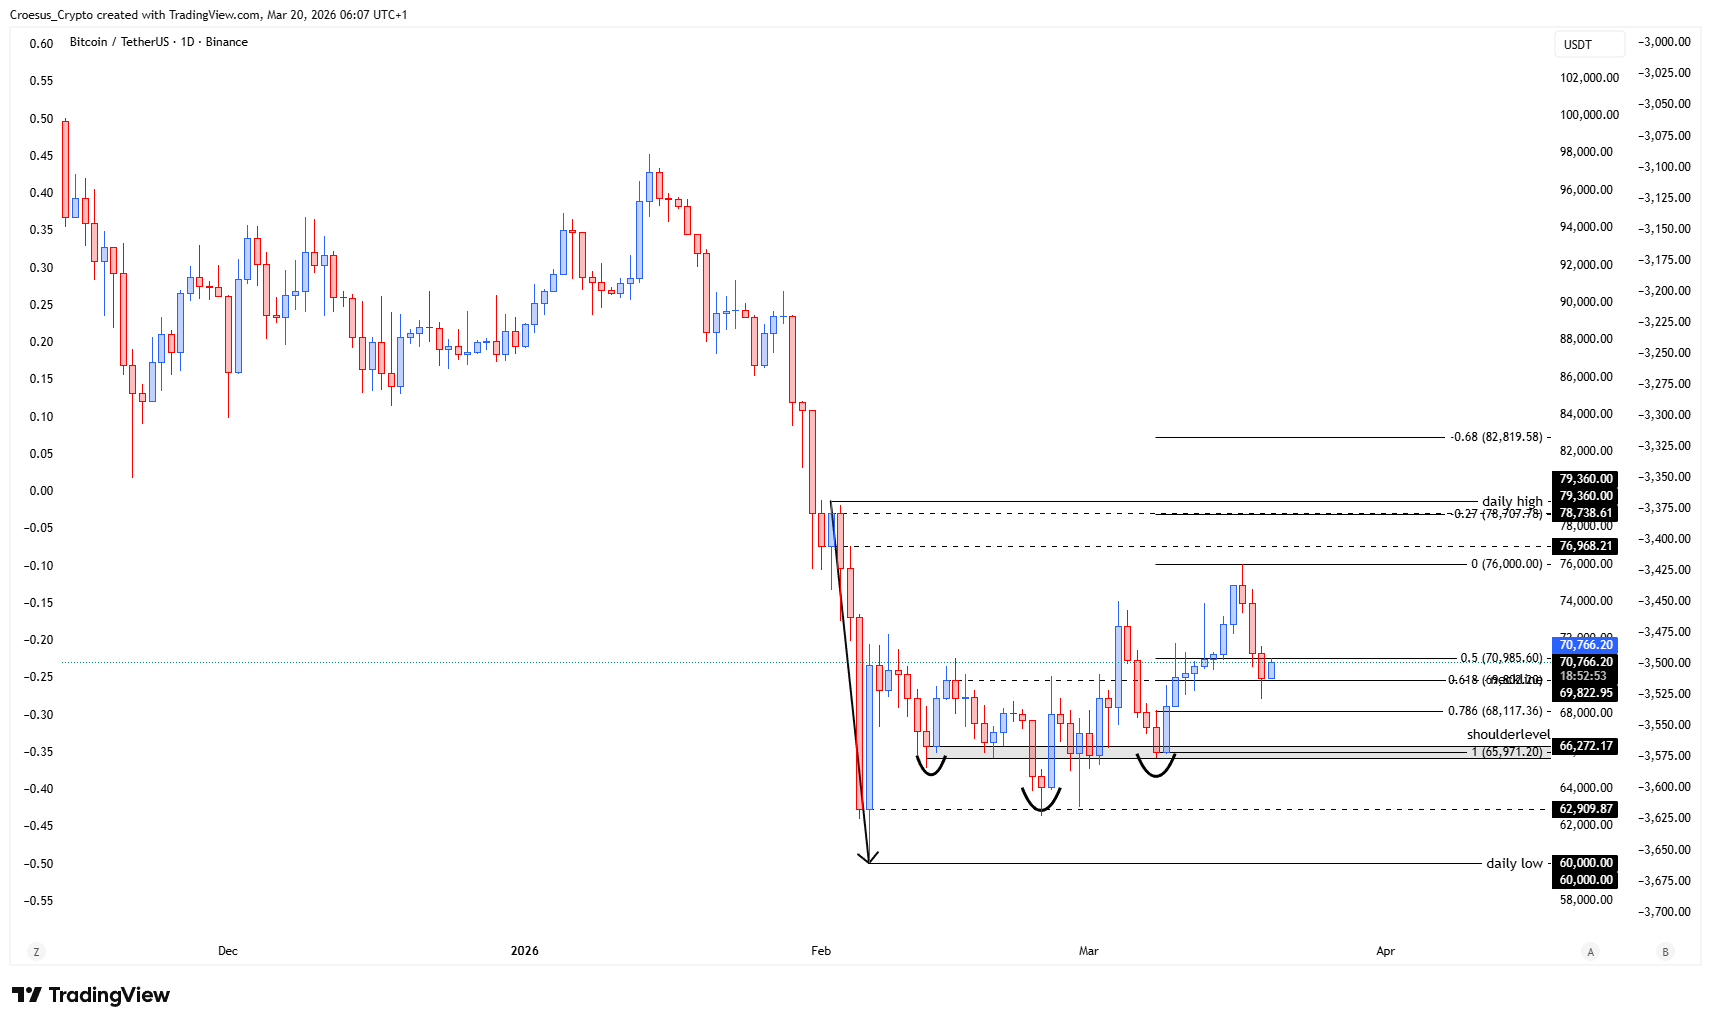
- If price can hold this level now, and we see a bullish reversal on the 4H, we could see an expansion towards the -0.27, which shows us a confluence with the daily highs.
Market Structure Analysis
From a market structure perspective, our BTC daily analysis centers on the neckline retest as the defining decision point. A neckline retest typically acts as a “make-or-break” zone: holding it suggests the relief move can build a corrective base, while losing it keeps the bearish impulse intact and opens room for continuation lower. The key nuance here is multi-timeframe alignment—while the daily context remains bearish, the draft highlights a potential 4H bullish reversal. If that reversal prints and follows through, it often signals short-term acceptance above the neckline, creating the conditions for expansion into overhead liquidity near the daily highs. The -0.27 reference functions as a Fibonacci-based confluence target in this scenario, but it only becomes actionable if the neckline starts behaving as support rather than resistance.
Key Levels and Scenarios
BTC daily analysis scenarios are clean: bullish follow-through requires sustained acceptance above the neckline, while bearish continuation is favored if price rejects the retest and rotates back below that structural level.
- Neckline level: the main support resistance pivot after the retest
- 4H reversal zone: the trigger area for bullish continuation if structure flips
- Daily highs: overhead liquidity/resistance area referenced as confluence
- -0.27 level: Fibonacci confluence target if expansion develops
Trading Implications
In a bearish environment, the neckline retest is typically a high-sensitivity area where risk increases due to whipsaw potential. Conservative participation generally waits for clear confirmation (acceptance above support or rejection back below), while aggressive positioning focuses on the first clean reaction from the neckline with tight invalidation based on structure.
This analysis is for informational purposes only and does not constitute financial advice.