


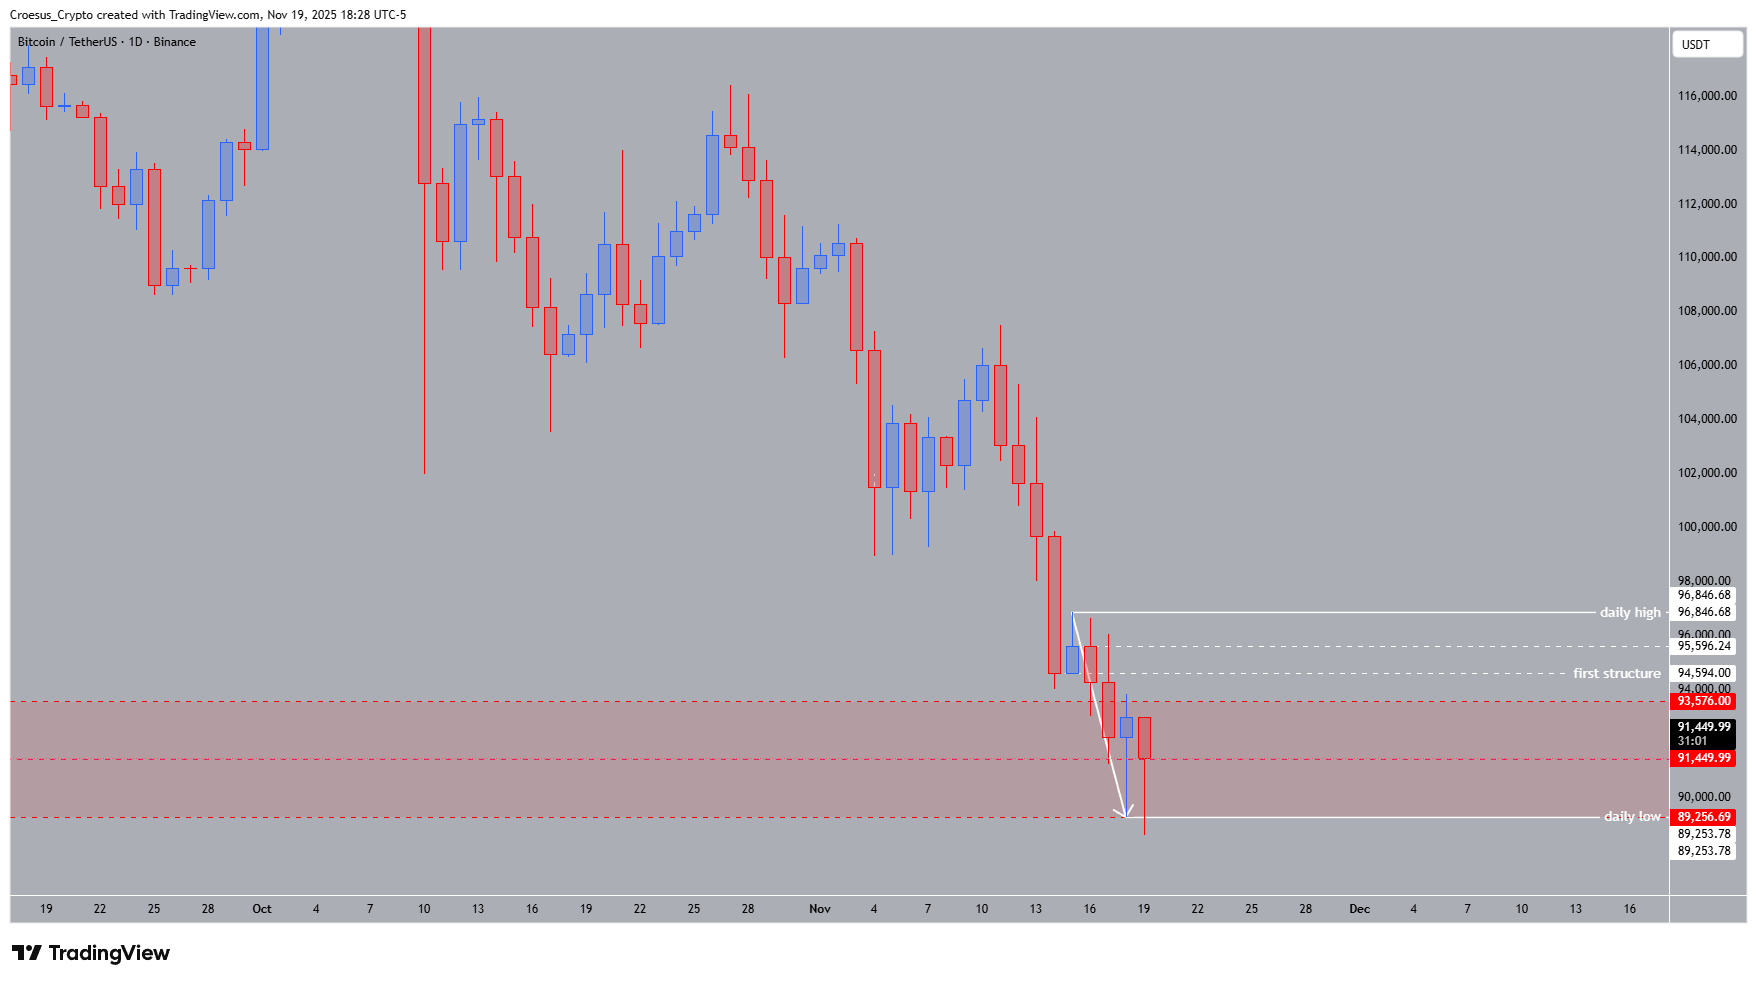
BTCUSDT daily chart 20 November 2025 with broken daily low at 89253.78 and resistance zone around 93–96k.
- Trend = bearish ↓
- Daily high =96.846,68$
- Daily low = 89.253,78 $
- Technical Analysis Key Points
- Daily structure shows a clear series of lower highs and lower lows, with the prior daily low around 87,809 now broken.
- Price rejected from the “first structure” resistance area @ 92.215,14 $ and expanded lower, confirming sellers in control.
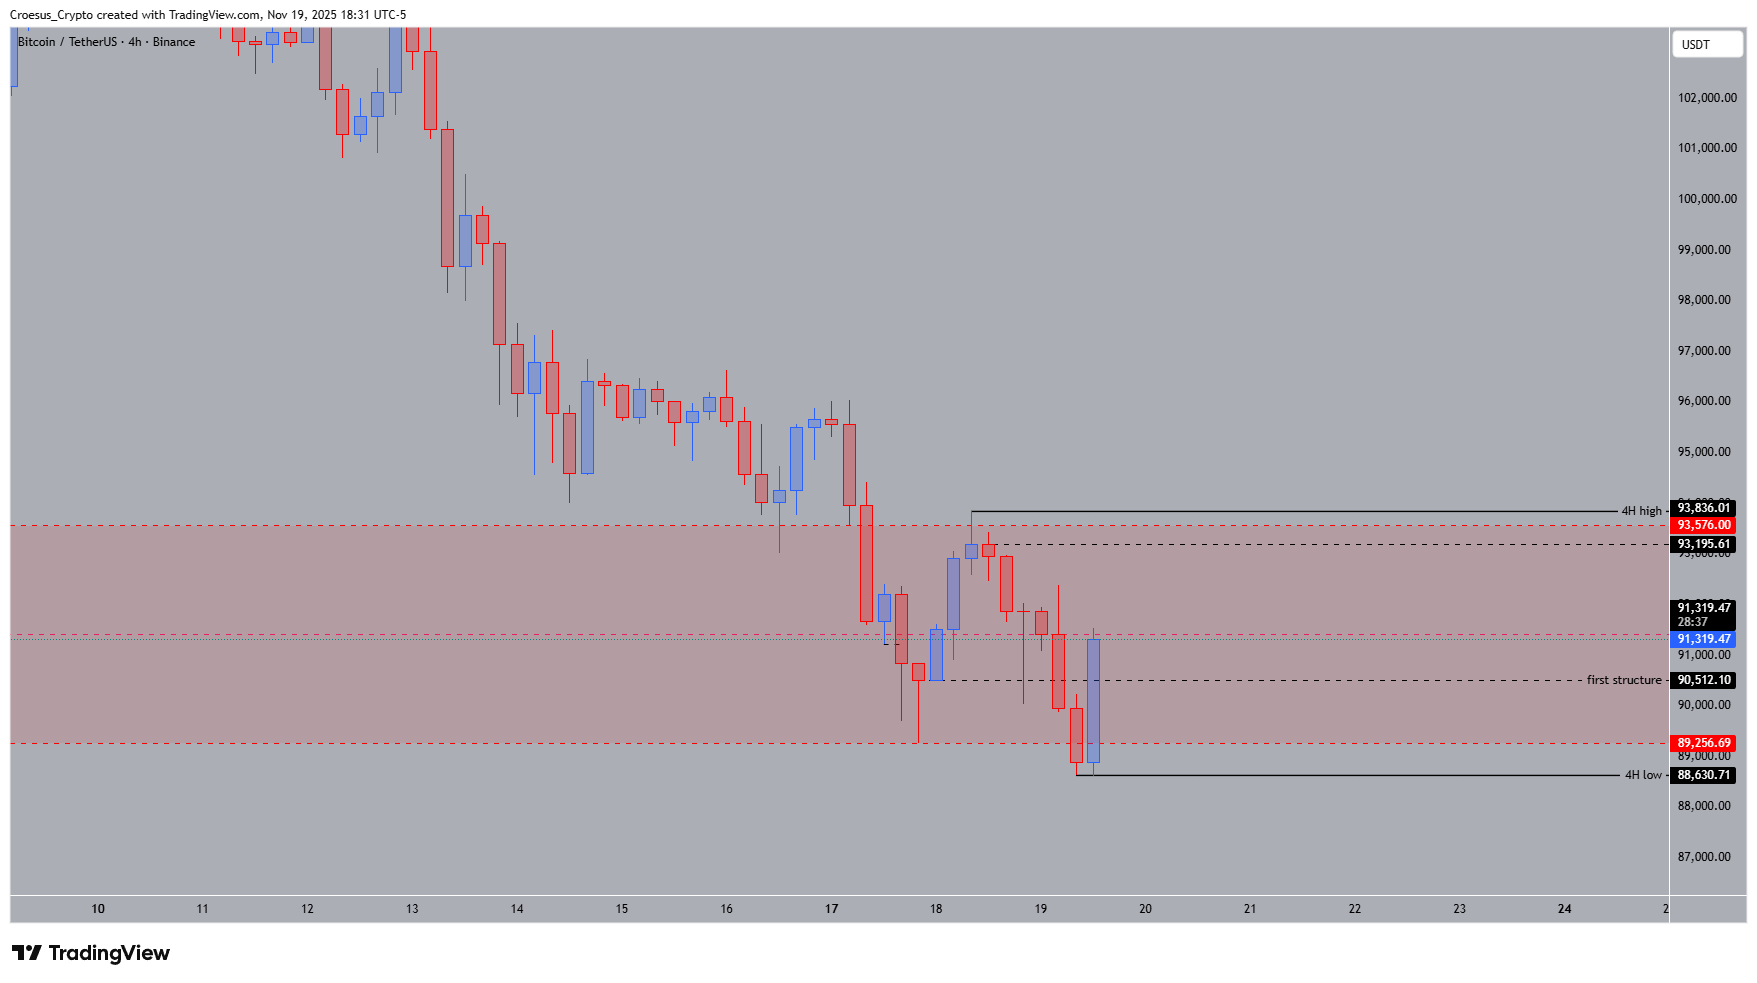
- The 4H chart keeps printing lower lows, with a fresh 4H low marked @ 86,100.00 $ (exactly!)
- A potential head/shoulder structure is visible on 4H between ~88,884.56 (shoulder) and ~92,440 (head), but it is not validated yet.
- Patience remains key !
BTCUSDT 4H chart 20 November 2025 with downtrend, local 4H low at 86,100 and potential head-and-shoulders structure around 89–93k.
Market Structure Analysis
From a market structure perspective, this Bitcoin daily analysis shows a mature bearish leg extending from the failed push above 100k into the current 80k–90k range. The rejection around the first structure zone at 92,256–93,576 turned that area into a strong support resistance flip. Breaking the daily low at 87,809 confirms continuation, with the daily candle closing deep below prior demand.
On the 4H timeframe, the trendline drawn from mid-November highs highlights continuous pressure from sellers. Price is currently trading between the broken daily low and the new 4H low near 86,100. The labelled head/shoulder area around 89,256–92,440 could evolve into a reversal pattern later, but at this stage it functions mainly as supply. No strong Fibonacci reaction stands out yet, keeping technical analysis biased to the downside.
The lack of a clear momentum shift—especially after a multi-week decline—reinforces the need for caution. Bulls must reclaim structure; until then, lower-timeframe bullish candles should be treated as corrective rather than trend-changing.
Key Levels and Scenarios
Bullish scenario (counter-trend):
Buyers need to reclaim 88,884 on a 4H and preferably daily closing basis, then break back above the first structure level (92,215)). That would open room for a squeeze toward the daily high @ 96,846.
Critical Levels to Watch
96,846 USD – Daily high: main upside target if a reversal develops
93,576 USD – Upper structure: key supply; acceptance above would weaken the bearish case.
89,253 USD – Daily low: Key liquidity sweep level
88,884.56 – First structure / shoulder: pivotal intraday resistance.
86,100 & 82,550 – 4H and major supports: downside continuation targets if selling resumes.
Trading Implications
For now, setups favor trend-following shorts on bounces into 87,800–89,500 with clearly defined invalidation, while conservative traders may prefer to stay sidelined until a confirmed higher low and break above structure shift risk/reward in favor of long exposure.
This content is for educational purposes only and does not constitute financial advice.