BTC Marketcap / Bitcoin
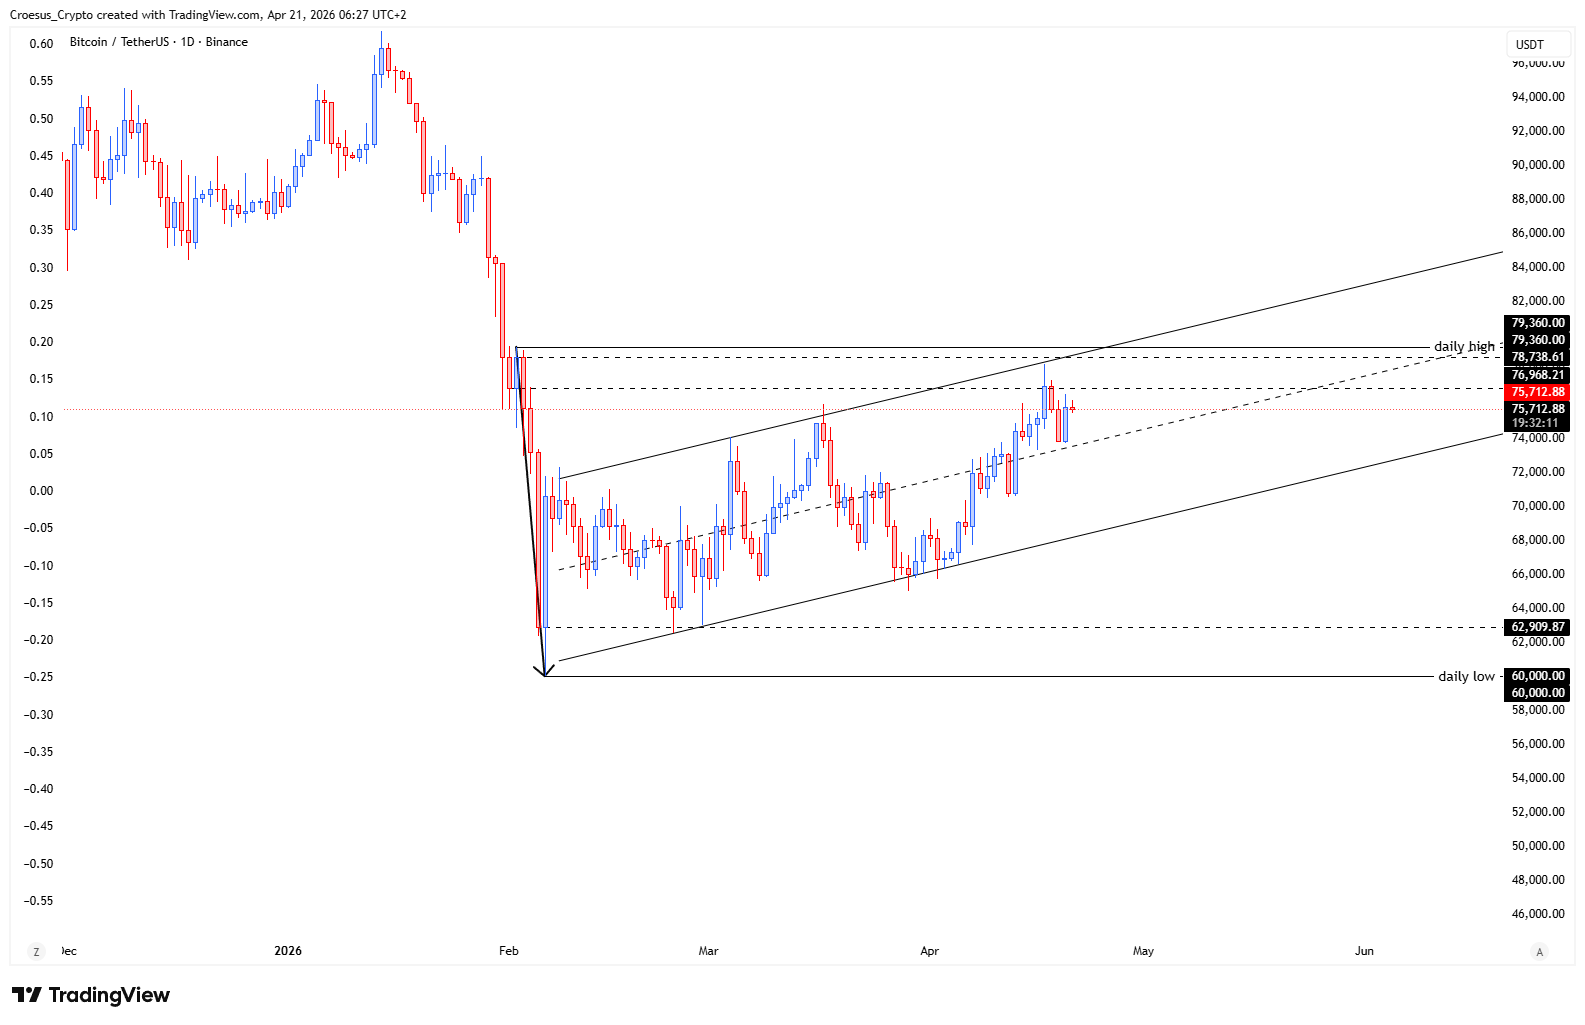
BTC daily analysis 20/04/2026. Bitcoin remains structurally bearish despite a prolonged counter-trend bounce, with price now compressing near the top of its corrective channel and close to a full retracement of the prior sell-off.
- Eventhough we all want BTC price to rise and shine, we need to remain neutral and analyse in that manner.
- What do we see : a bearish impulse followed by a long and tidious (74 days !) bullish correction, now nearly hitting the fib 100% retracement. We nearly corrected the entire bearish impulse in a rising channel, also called a correction with the trend or a bear flag. Give it whatever name you want : bulls took 74 days to correct 3 bearish days and still did not succeed in pushing through the upper limit of the range.
- Bullish : break and hold of daily high
- Bearish : printing lower lows and losing the lower limits of the rising channel.
Market Structure Analysis
Our BTC daily analysis focuses on the mismatch between the initial bearish impulse and the slow, grinding recovery that follows. Structurally, a rising channel after a sell-off often behaves as a corrective structure (a “bear flag”), where price retraces while liquidity rebuilds before the trend potentially resumes.
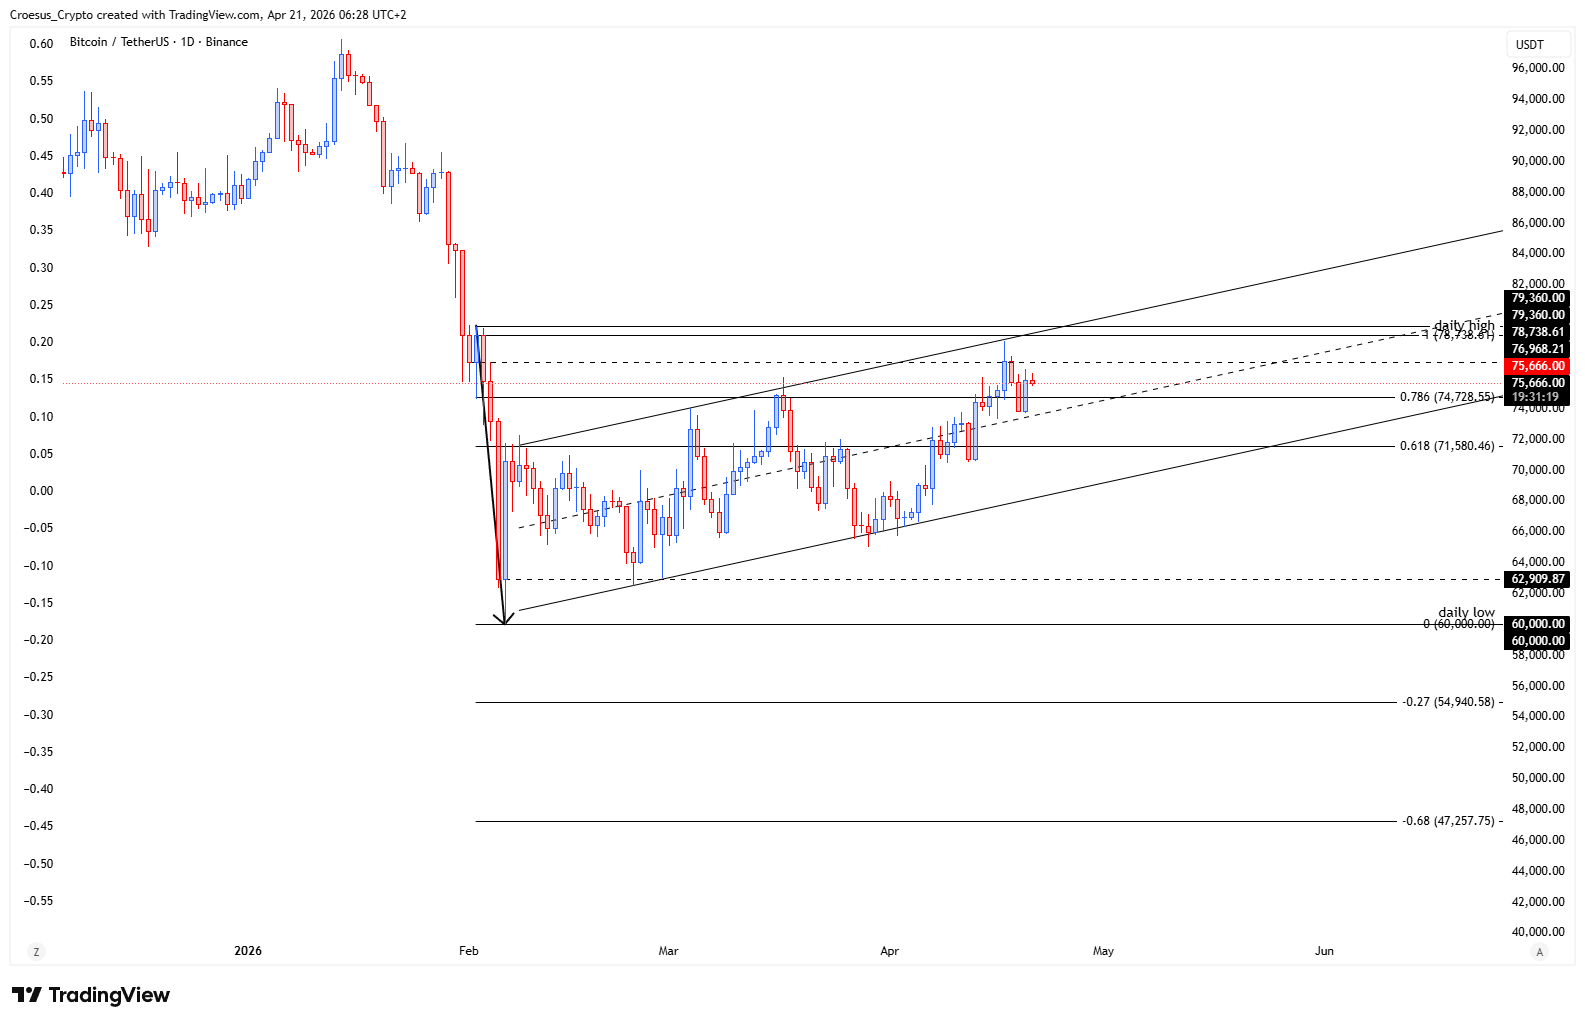
The key detail is that this correction has stretched over 74 days and is now near a Fibonacci 100% retracement, yet price still fails to reclaim the upper limit of the range. That combination keeps the burden of proof on buyers: until the range high breaks and holds, the move reads as corrective rather than a fresh bullish impulse.
Key Levels and Scenarios
BTC daily analysis scenarios are defined by clean support resistance reactions around the corrective channel and range boundaries. Bulls need acceptance above the daily high to shift structure. Bears regain control if price breaks down from the channel and starts printing lower lows again.
- Daily high: bullish confirmation requires a break and hold
- Upper limit of the range: overhead resistance that has capped the 74-day correction
- Fibonacci 100% retracement area: decision zone for continuation vs rejection
- Lower limits of the rising channel: bearish trigger if lost with follow-through
Trading Implications
From a risk perspective, this is a late-stage corrective area: aggressive traders typically wait for a decisive break (either above the daily high or below channel support), while conservative traders look for confirmation via a clear break of structure and acceptance back at key levels.
This analysis is for informational purposes only and does not constitute financial advice.