


BTC Marketcap / Bitcoin
BTC daily analysis 20/05/2026. Bitcoin remains in a bearish environment, but our BTC daily analysis highlights an early sign of short-term stabilization as price prints a first bullish candle that kicks off a local relief move.
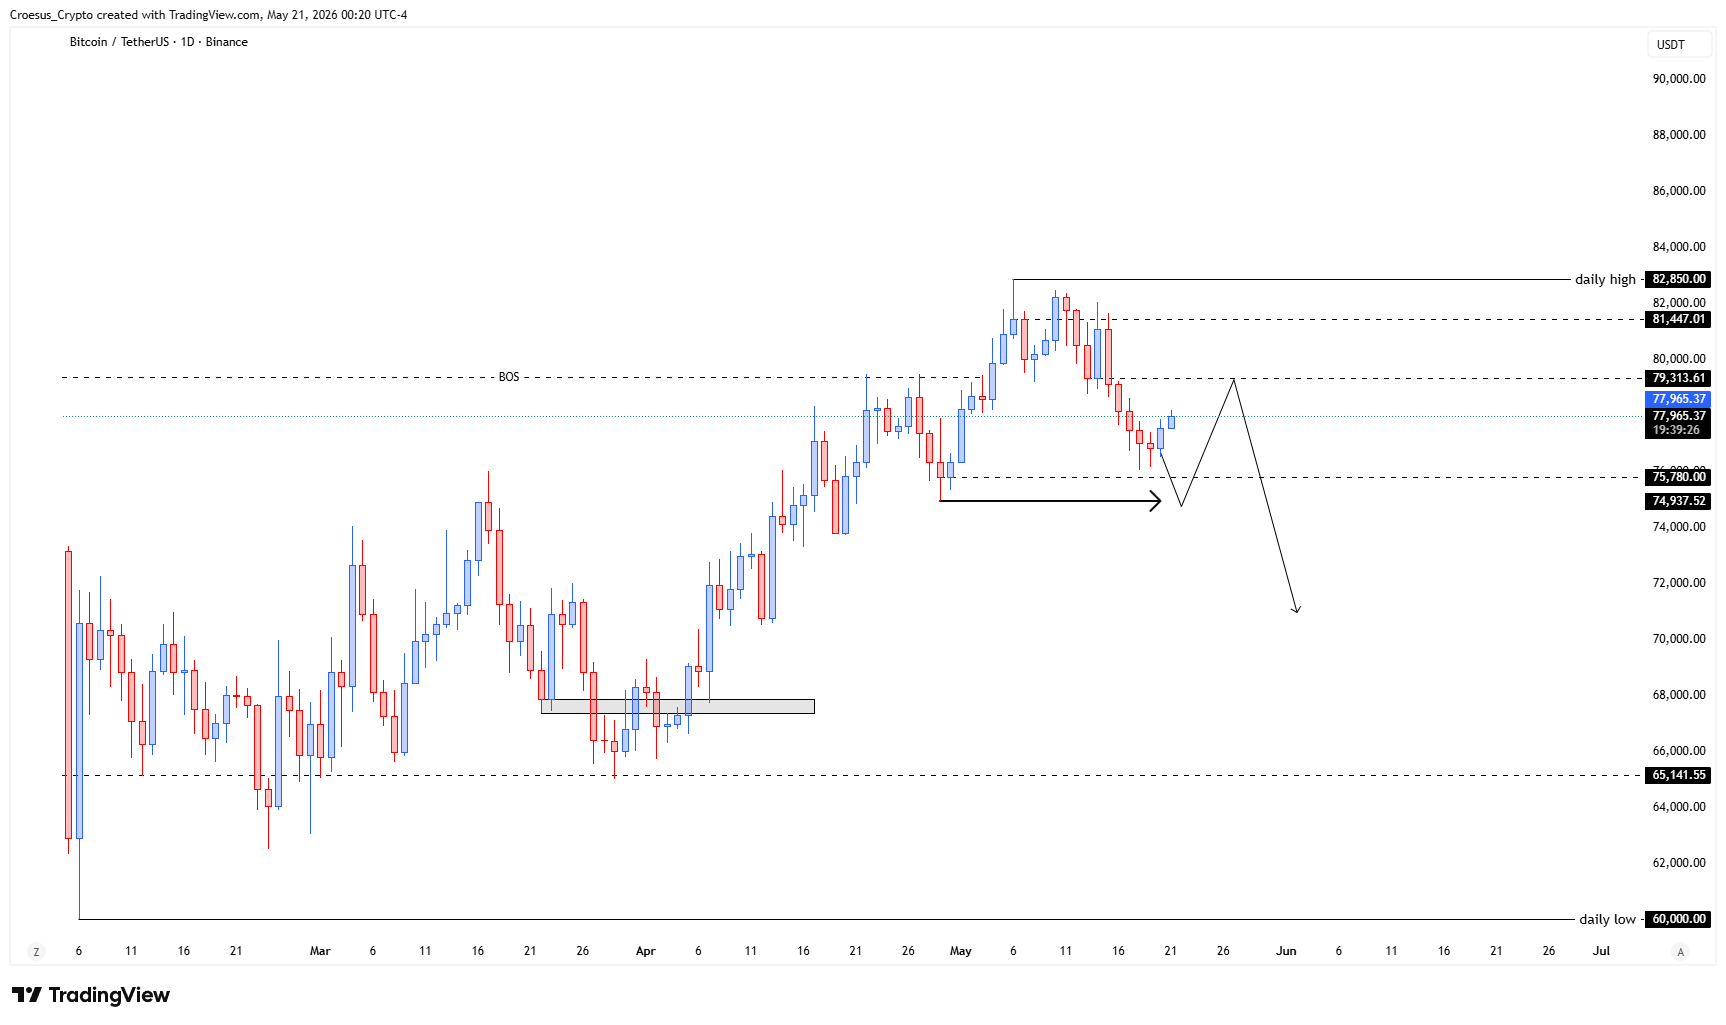
- BTC shows us that the price printed its first bullish candle starting up a local relief move.
Market Structure Analysis
In a bearish trend, the “first bullish candle” is not a trend reversal by itself, but it is often the first structural hint that selling pressure is pausing and that a corrective bounce is attempting to develop.
From a naked trading perspective, this typically shows up as price reacting from a local demand area and starting to challenge the nearest horizontal resistance created by the most recent breakdown zone. For our BTC daily analysis, the key question is whether this relief move stays corrective (lower highs inside the broader downtrend) or evolves into a break of structure where price can reclaim prior supply and hold it on a retest. Until that happens, the broader bearish bias stays intact and the bounce is treated as countertrend price action.
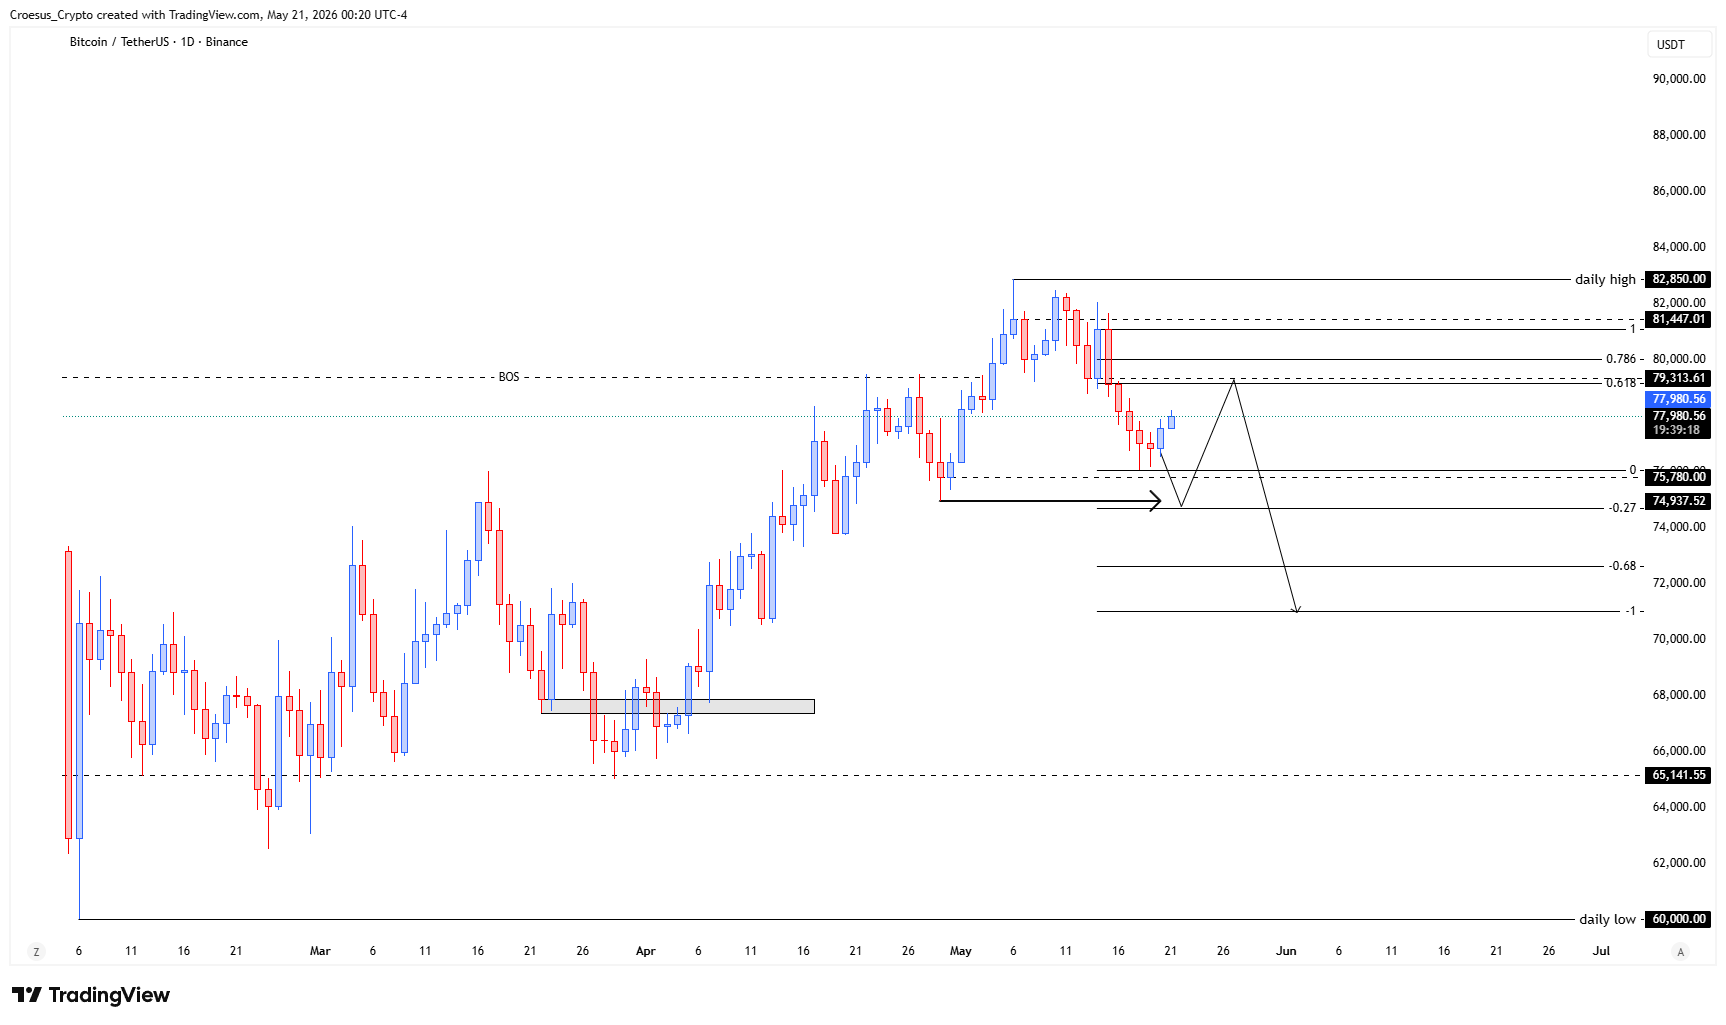
Key Levels and Scenarios
For BTC daily analysis, the bullish (relief) scenario requires follow-through and acceptance above the nearest short-term resistance created by the prior sell-off. The bearish continuation scenario remains favored if the relief move fails to reclaim that supply zone and price rotates back toward the recent swing low, keeping market structure bearish.
- Recent swing low: key continuation trigger if price rolls over and breaks back below support
- Breakdown / supply zone above current price: primary resistance to reclaim for a stronger corrective bounce
- Current reaction base: short-term support that should hold if the relief move is sustainable
- Recent swing high inside the downtrend: confirmation area for any meaningful structure shift (needs a reclaim and hold)
Trading Implications
In a bearish trend, relief rallies can be sharp but short-lived, so execution typically depends on confirmation: aggressive participants may trade the bounce as a correction, while conservative traders often wait for a clear break of structure and a clean retest of reclaimed support resistance before treating it as more than a countertrend move.
This analysis is for informational purposes only and does not constitute financial advice.