


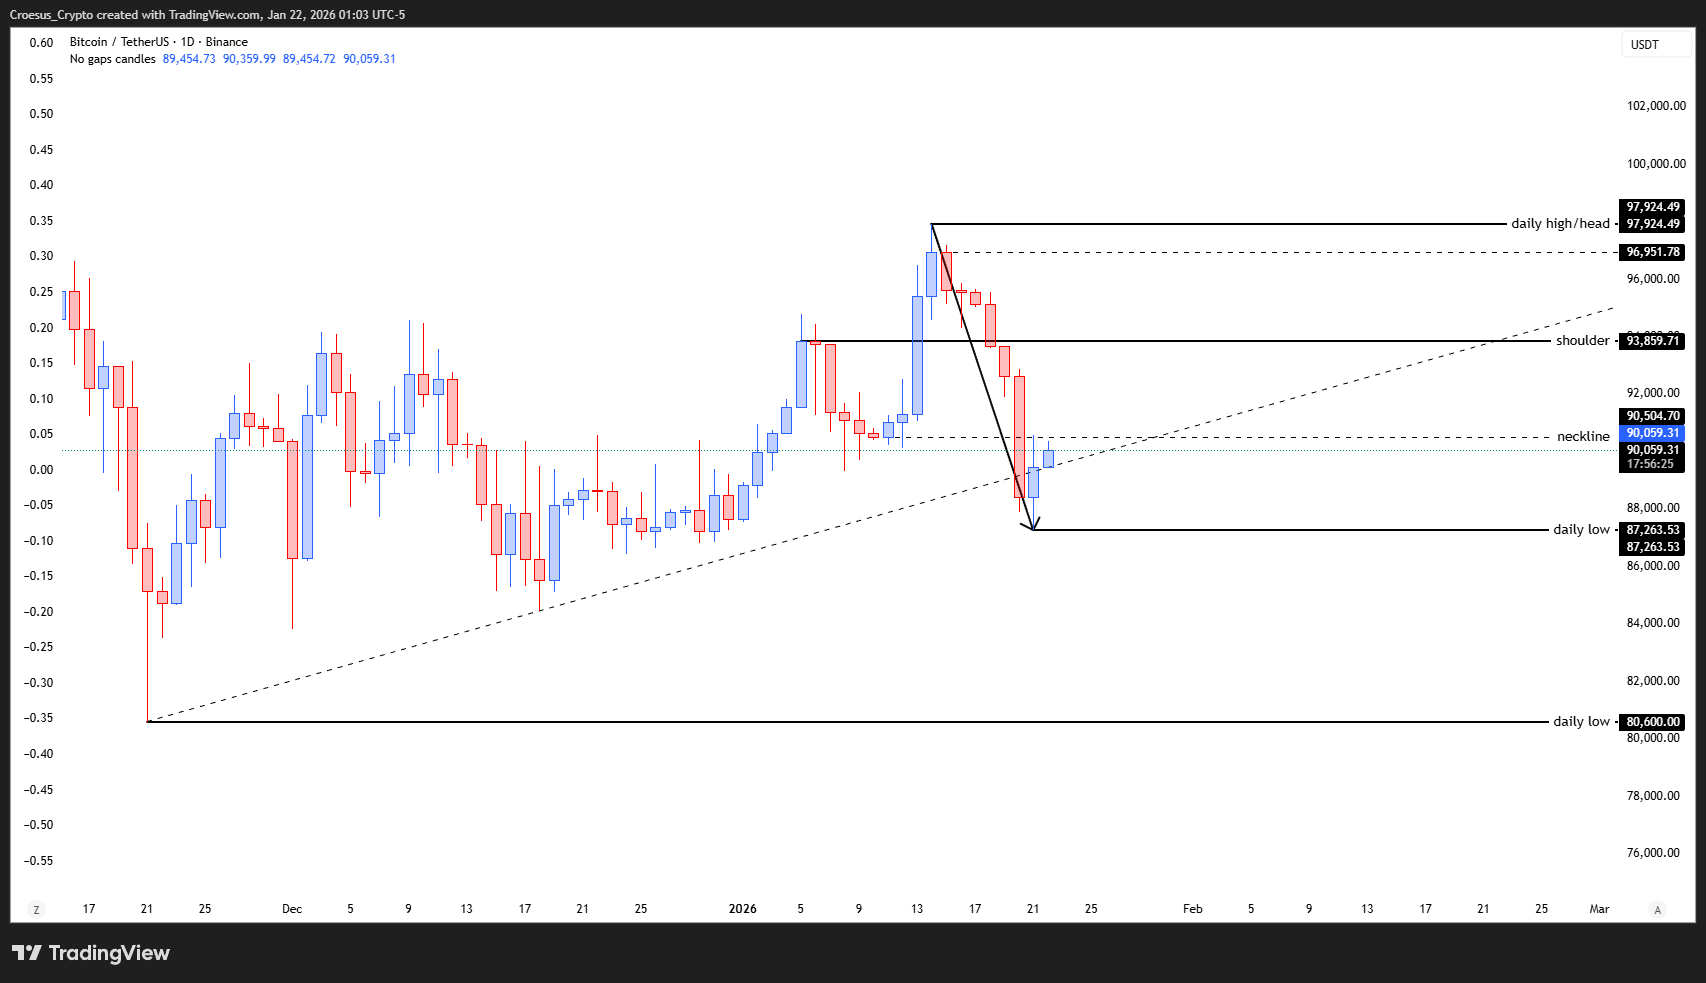
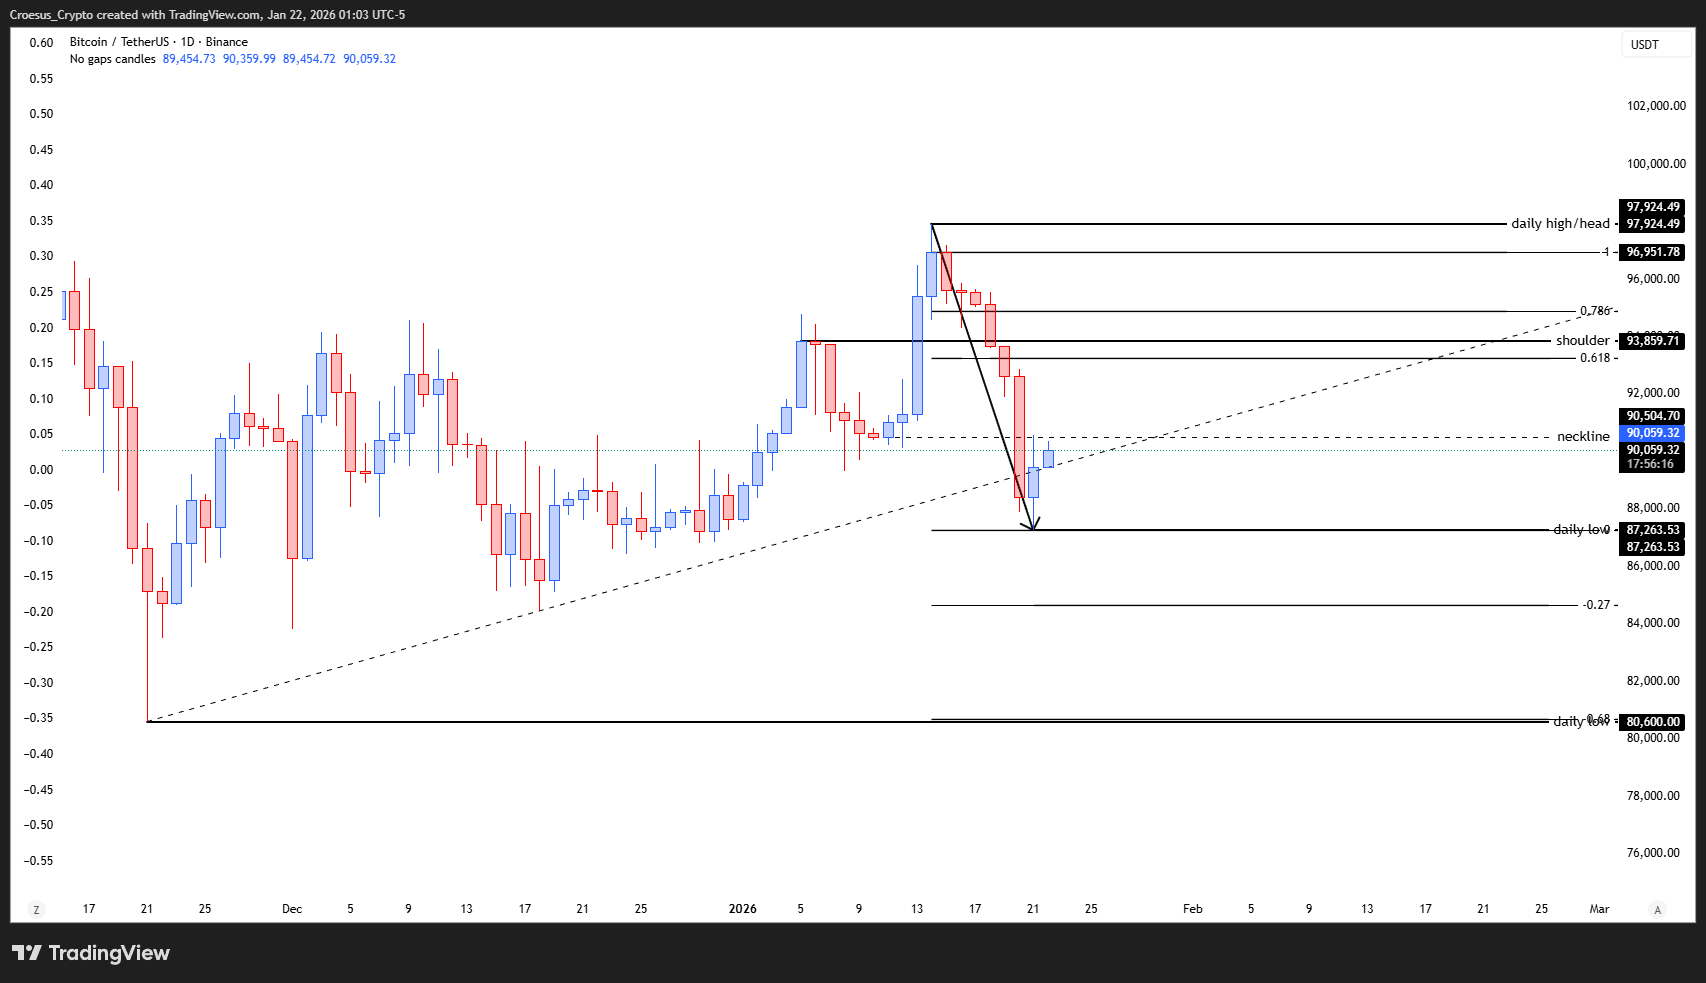
Bitcoin daily analysis on the BTCUSDT pair shows the index pushing a bit further down into the rising trendline before buyers stepped in and printed a bullish daily candle around 87,263 USDT. This bullish reaction defines a clear swing high at the “daily high/head” near 97,924 USDT and a swing low at the recent wick, allowing us to anchor a precise Fibonacci retracement and refine our support resistance zones within the ongoing correction.
Bitcoin daily chart 21 January 2026 with neckline, shoulder, daily high/head and daily lows
Technical Analysis Key Points
- The index pushed a little further down but finished with a bullish candle.
- This mean that we can draw our fib retracement now.
- The correction is continuing as analysed.
Market Structure Analysis
From a technical analysis perspective, price remains within a broader ascending structure, but the recent impulsive leg down from 97,924 USDT broke below the prior shoulder level at 93,859 USDT and has been hovering around the neckline near 90,504 USDT. The rejection into the 87,263 USDT daily low coincides with the lower trendline, suggesting that sellers are taking profit while buyers attempt to defend this demand zone. With the high-low leg set, the 0.618 Fibonacci retracement sits just under the shoulder region, while the 0.786 retracement lines up closer to 96,951 USD. As long as price trades below these retracement levels, we continue to treat current price action as a corrective phase rather than a full bullish reversal.
Key Levels and Scenarios
Bullish scenario: If Bitcoin holds above the 87,263 USD daily low and reclaims the neckline at 90,504 USD, a push into the 0.618–0.786 Fibonacci band (around 93,859–96,951 USD) becomes likely, where we expect strong reaction.
Levels to watch
97,924 USDT – Daily high/head: Major resistance and correction origin.
96,951 USDT – 0.786 Fibonacci area: Upper resistance zone within the retracement.
93,859 USDT – Shoulder / 0.618 region: Key resistance; reclaim would strengthen bullish momentum.
90,504 USDT – Neckline: Short-term pivot between bearish and bullish control.
87,263 USDT – Daily low: Primary support; a break below exposes the next daily low at 80,600 USD.
Trading Implications
For active traders, the cleaner setups sit either on short entries from the 0.618–0.786 retracement band with tight stops above invalidation, or on confirmed break-and-hold above the shoulder, targeting the head high while keeping position sizes modest relative to account risk.
This is not financial advice; always do your own research and manage your risk appropriately.