


This BTC daily analysis for late December 2025 shows the same range-bound structure we see on TOTAL: a sharp prior bearish leg followed by sideways price action between the daily low and the range high.
Our technical analysis suggests room for a short-lived “Santa Run”, but the broader market structure remains bearish as long as the main resistance zone holds.
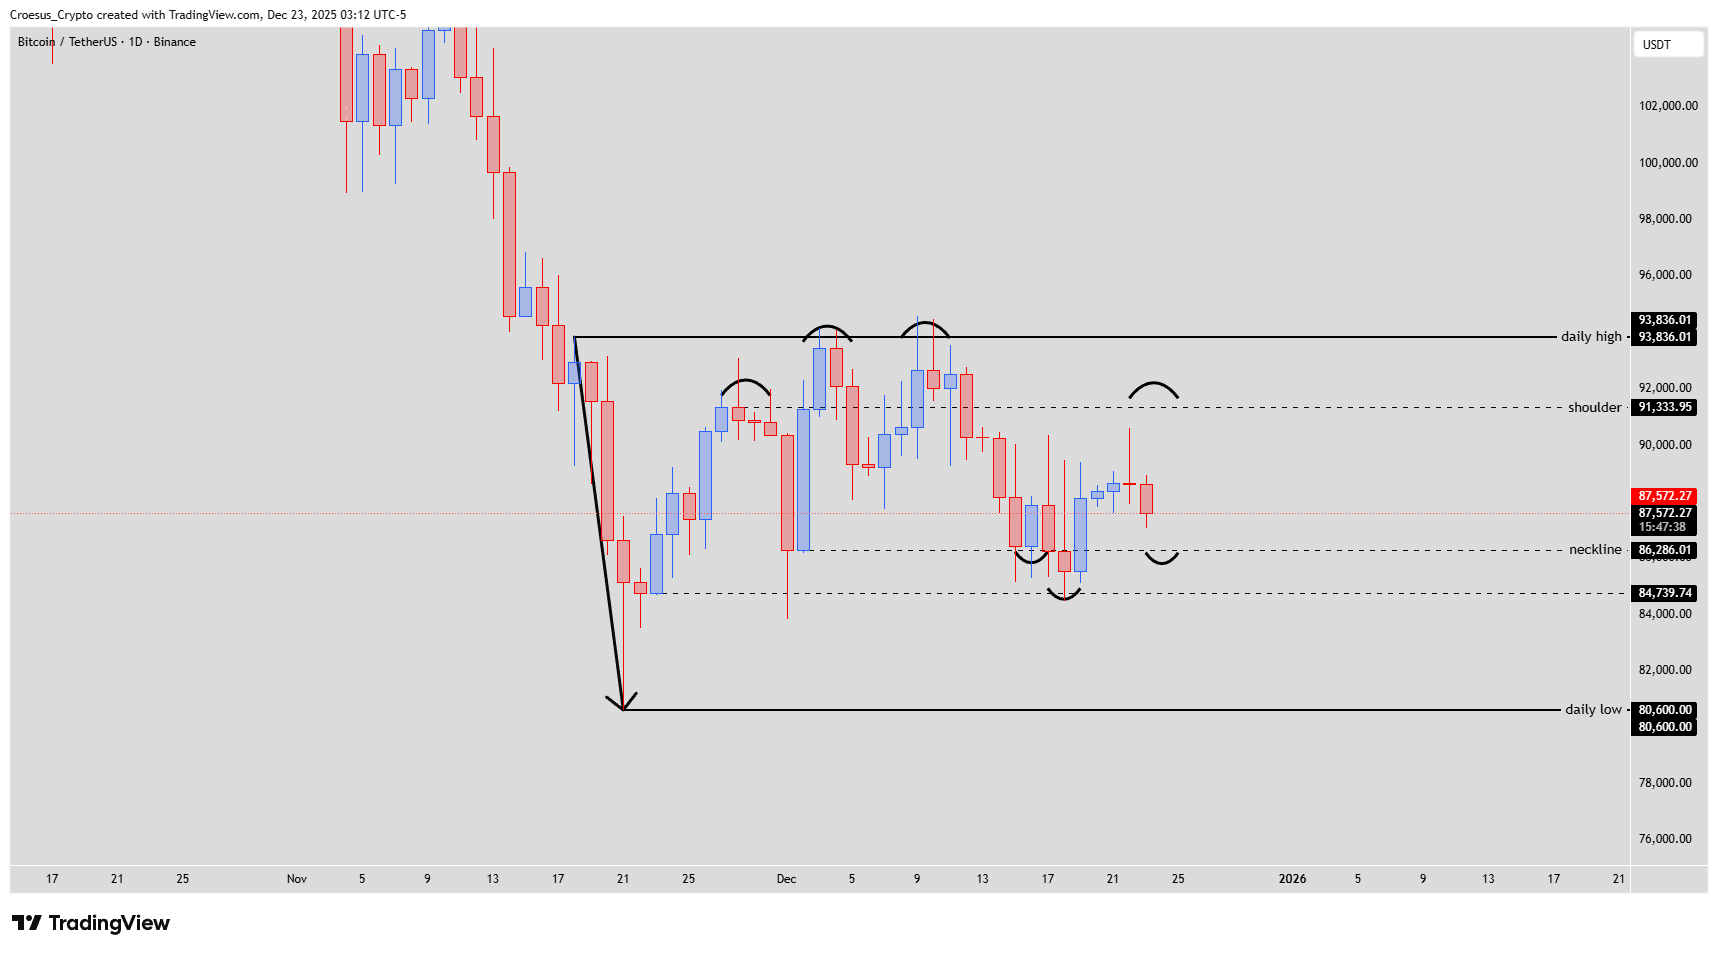
BTC daily chart 22 Dec 2025 with sharp prior selloff, range between 80,600 and 93,836 and head & shoulders structure.
Technical Analysis Key Points
- Same structure as TOTAL
- After making a fractal low on Thursday last week, the price made an impulsive bullish move up.
- If we try to understand the marketmakers-game : last Friday was the last trading day before the holiday season. Every movement on the charts now is made by retail. On Friday marketmakers have the retail some "hopium". The bottom is in, we can go up. What will retail do during the holiday season ? Buy, buy, buy. Why do we see the correction at this moment ? Retail was supprised by the move and wants lower prices at the start of the push. Marketmakers gives them those prices.
- Retail wants a Santa Run. We will see one. About 5%. But will it be sustained ?
- At this moment we can see a fractal bullish reversal pattern (inverse head and shoulders) being printed. The neckline of the bigger head and shoulder pattern could act as the shoulderlevel of the inverse head and shoulder pattern.
- if we take the fib retracement of this pattern, we can see that the -0.68 level is just above the shoulder level. A Santa Run from the neckline to the shoulder is possible.
- But take into consideration : this move is still countertrend and thus higher risk. As long as we don't break the daily high @ $93.836, we remain bearish.
Market Structure Analysis
Our BTC daily analysis highlights a classic market-maker play around the holiday period. After printing a new fractal low near the range bottom, BTC pushed up impulsively, giving retail the impression that “the bottom is in.” With traditional markets closed, flows are mostly retail, which explains the choppy pullback as participants look for better entries before the next push.
The current fractal bullish reversal aligns with an emerging inverse head & shoulders built inside a larger head & shoulders. The former neckline around the bigger pattern now acts as potential support and may serve as the shoulder level for the new inverse setup. This confluence strengthens the case for a corrective bounce, but with no break of structure above the daily high at 93,836, the dominant trend remains down.
Key Levels and Scenarios
Bullish scenario: A “Santa Run” of roughly 5% from the neckline area toward the shoulder region is plausible while the inverse head & shoulders completes and the Fibonacci -0.68 extension just above 91,000 is tested. Until price closes above 93,836, we treat this as a countertrend rally.
Key levels to watch:
80,600 – daily low and macro support; loss would reopen downside.
84,740 – interim support inside the range; failure here weakens the reversal.
86,286 – neckline zone for the current bullish reversal pattern.
≈91,334 – shoulder level and main “Santa Run” target, aligning with resistance.
93,836 – daily high; only a break above here shifts our bias away from bearish.
Trading Implications
From a trading standpoint, this BTC daily analysis suggests tactical long opportunities only for aggressive traders: position sizing should be conservative, entries should focus around the neckline with clear invalidation below recent lows, and profits can be managed into the 91K region while remembering this is still a countertrend move against the prevailing bearish structure.
This is not financial advice; always do your own research and manage your risk appropriately.