


Bitcoin daily analysis for 23 December 2025 shows BTC consolidating after a strong sell-off, with market structure hinting at a potential inverse head and shoulders formation. While the pattern is becoming clearer, price action has not yet fully aligned with the preferred daily entry conditions.
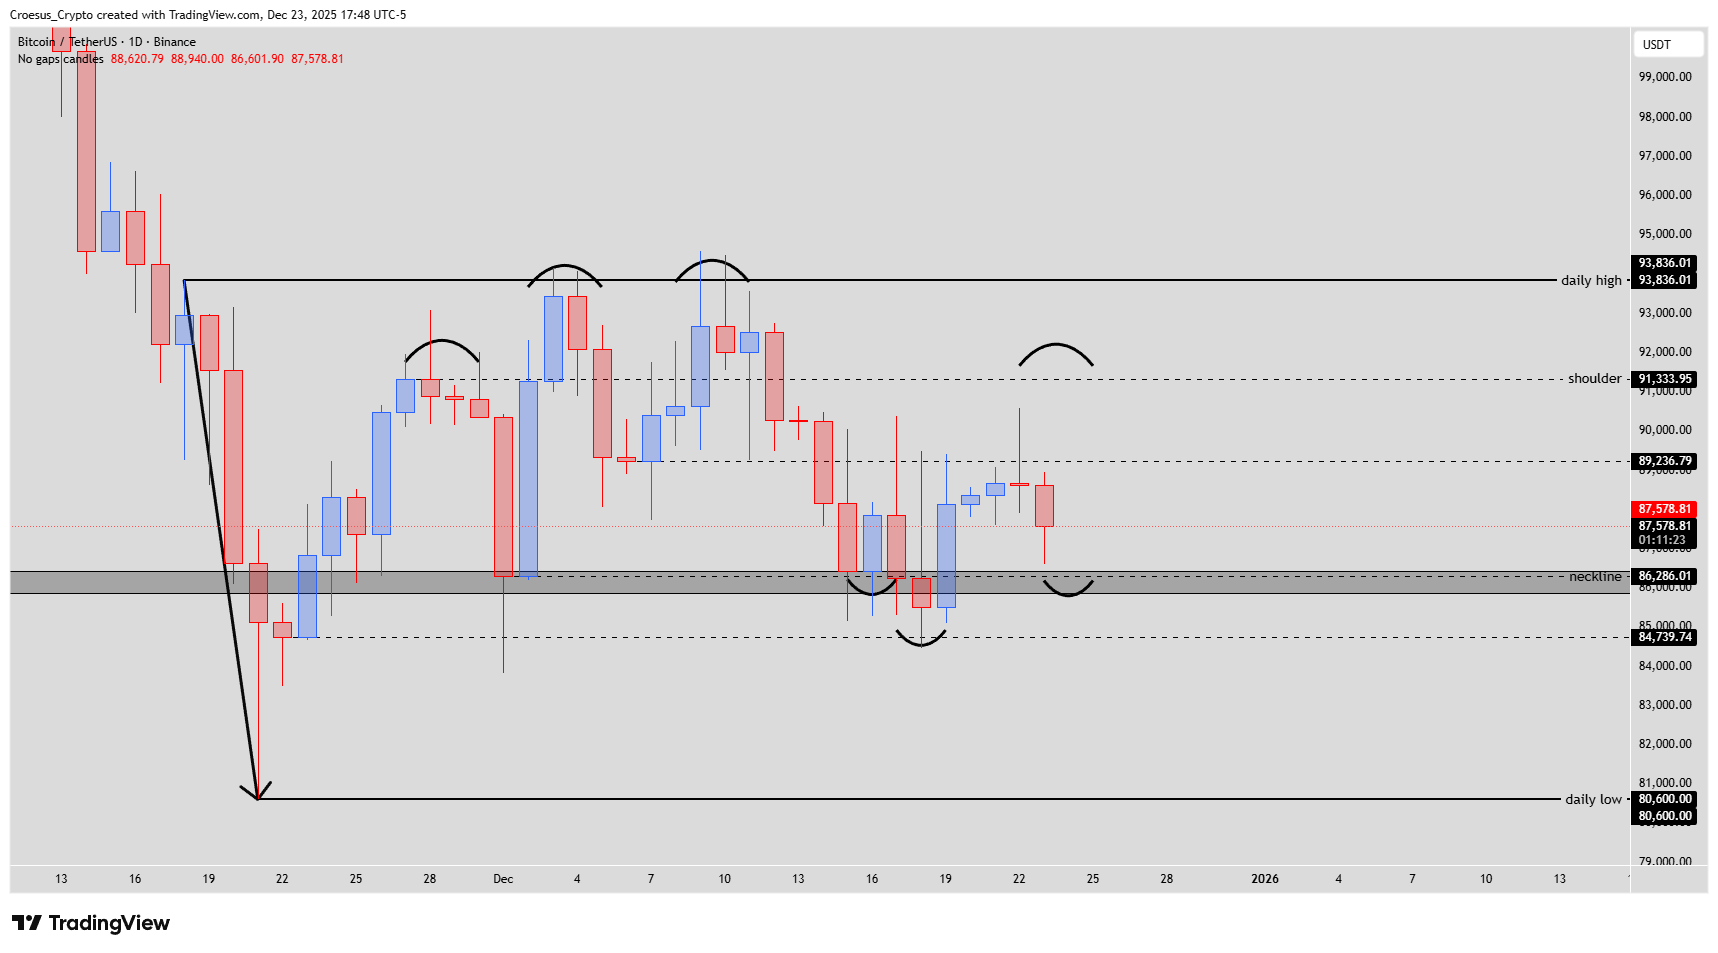
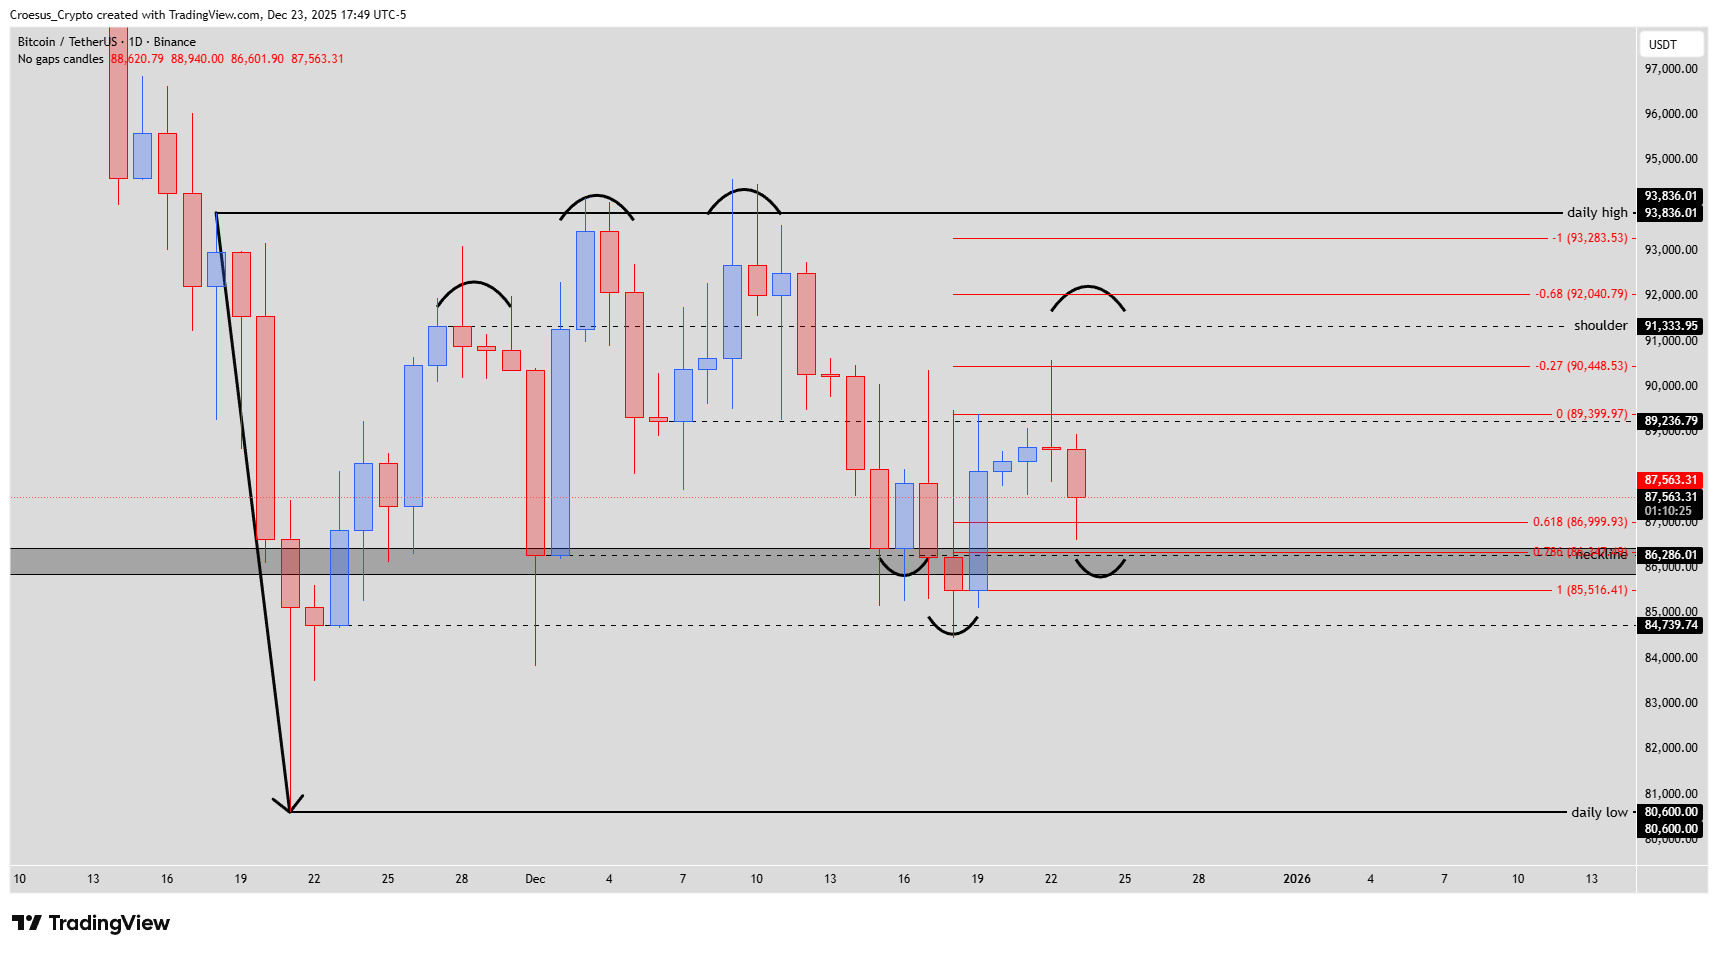
Bitcoin daily chart Dec 23 2025 showing inverse head and shoulders, daily entry zone near 86.3k, and resistance toward 91.3k
Technical Analysis Key Points
- just as with the TOTAL we can clearly see an inverse head and shoulder being printed.
- Price didn't quite hit the daily entry zone (black box) @ the shoulderlevel yet
- We would like to see BTC drop a little bit more @ $86.286 before going bullish to retest the shoulderlevel of the larger head and shoulders pattern @ $91.333.
- This could be a valid trade but remains to be catagorized as a higher risk trade. As the prevailing trend is still bearish, this is a countertrend.
Market Structure Analysis
From a market structure perspective, BTC remains in a corrective phase within a broader bearish trend. The potential inverse head and shoulders is forming after a sharp impulsive drop, with the neckline region around 86.2k–86.3k acting as a key reaction zone. So far, price has front-run this level, leaving the daily entry technically untested.
Above price, the 91.3k shoulder level represents the first major resistance and aligns with prior structure and Fibonacci retracement resistance. A move into that zone would still be considered a corrective bounce unless BTC can reclaim and hold above it. Until then, this BTC daily analysis remains cautious, focused on reactions rather than confirmations.
Key Levels and Scenarios
Bullish scenario: A controlled drop into 86,286 followed by a strong reaction would support a bounce toward 89.2k first and 91,333 next, representing roughly +6% upside from the entry zone.
Critical levels to watch
$93,836: Daily high / invalidation for bearish structure
$91,333: Shoulder resistance of the larger inverse H&S
$89,237: Intermediate resistance / reaction level
$86,286: Daily entry zone / neckline support
$84,740–80,600: Downside extension if support fails
Trading Implications
From a trading perspective, the daily entry has not yet been hit, meaning patience is still required. A move into $86.286 would allow traders to shift focus to the 4H timeframe to look for a fitting entry model before considering long exposure. This setup remains countertrend, as the prevailing daily structure is still bearish. As such, it carries higher risk, demanding tight risk control, conservative position sizing, and clear invalidation below the neckline. Until BTC breaks and accepts above the daily high at 93,836, the broader trend remains bearish. Even a reclaim of the 91,333 shoulder level would still represent a reactionary move within a corrective structure. As such, any long exposure — including moves above the shoulder — must continue to be treated as countertrend, with conservative sizing and strict risk management.
This is not financial advice; always do your own research and manage your risk appropriately.